Zig Zag ++ SG (Premium)🔥 Zig Zag ++ SG
Professional Market Structure & Cycle Analyzer
Zig Zag ++ SG is an advanced, research-grade market structure indicator built on top of a refined ZigZag engine, designed for traders and investors who want to understand price cycles, not chase candles.
This is not a buy-sell arrow tool.
It is a decision-support system used to analyze trend strength, exhaustion, pullback depth, and cycle behavior across any market and timeframe.
🧠 What Makes Zig Zag ++ SG Different?
Most ZigZag indicators only draw lines.
Zig Zag ++ SG answers the real questions:
Is the trend getting stronger or weaker?
Are higher highs still meaningful?
How deep are pullbacks in percentage terms?
Which stocks recover fast vs stay weak?
Is this accumulation, distribution, or reversal?
It does this by combining:
Market Structure (HH / HL / LH / LL)
Consecutive structure counting
Gain & fall percentage per swing
Clean visual logic (no repaint confusion)
📌 Core Features
✅ 1. Automatic Market Structure Detection
Labels every major swing as:
HH – Higher High
HL – Higher Low
LH – Lower High
LL – Lower Low
This instantly shows whether the market is:
Trending
Consolidating
Distributing
Reversing
✅ 2. Consecutive Structure Count (ON by default)
Each structure type is counted sequentially:
HH (1), HH (2), HH (3)…
HL (1), HL (2)…
This reveals:
Trend maturity
Exhaustion zones
Early breakdown warnings
Example:
HH (4) = trend may be overextended
HL (3) = healthy trend continuation
✅ 3. Gain & Fall % on Every Swing (ON by default)
Every HH, HL, LH, LL shows:
Exact % move from the previous pivot
This allows you to:
Compare pullback depth across stocks
Identify leaders (shallow HLs)
Spot weak stocks (deep HLs / LHs)
Study cycle symmetry
Example label:
HL (2)
-6.4%
✅ 4. Clean, Readable Visual Design
🟩 Green labels → White text
🟥 Red labels → High-contrast white text
Optional background trend shading (OFF by default)
Works perfectly in dark & light mode
Designed for long chart study sessions, not flashy screenshots.
✅ 5. Safe Repaint Logic (Transparent by Design)
Uses ZigZag logic intentionally
No fake “non-repainting” claims
Ideal for analysis, research & planning
What you see is structurally correct
This indicator is for thinking traders, not signal chasers.
⚙️ Best Settings (Recommended)
🔹 Intraday Trading
Timeframe: 5m / 15m
Depth: 8–10
Deviation: 3–5
Backstep: 2
🔹 Swing Trading (Most Popular)
Timeframe: Daily
Depth: 12–15
Deviation: 5
Backstep: 2
🔹 Long-Term / Investing
Timeframe: Weekly
Depth: 15–20
Deviation: 5–8
Backstep: 3
💡 Tip:
Lower depth = more swings
Higher depth = cleaner, major cycles
📈 How to Use Zig Zag ++ SG (Practically)
🔹 Trend Strength
HH (3+) + HL (2–3)
→ Strong, healthy trend
🔹 Exhaustion Warning
HH (4+)
→ Risk of distribution or slowdown
🔹 Pullback Quality
HL −3% to −7%
→ Strong stock
HL −12% to −20%
→ Weak hands / fragile trend
🔹 Reversal Confirmation
LH followed by LL (2+)
→ Trend change likely
🧪 Who Is This Indicator For?
✅ Swing traders
✅ Positional traders
✅ Long-term investors
✅ Market structure students
✅ Stock researchers
✅ Anyone tired of noisy indicators
❌ Not for:
People wanting instant buy/sell arrows
Scalpers chasing 1-minute signals
“Magic indicator” seekers
💎 Why This Is Worth Purchasing
Built with Pine Script v6 best practices
Solves real market questions
Helps avoid:
Buying late
Selling early
Holding weak stocks too long
Encourages process-driven trading
One-time learning tool you’ll use for years
Most traders lose money not because of entries —
but because they misread structure and cycles.
Zig Zag ++ SG fixes that. Indicador

RSI Trend Authority [JOAT]RSI Trend Authority - VAR-RSI with OTT Trend Detection System
Introduction
RSI Trend Authority is an open-source overlay indicator that combines Variable Index Dynamic Average (VAR) smoothed RSI with the Optimized Trend Tracker (OTT) to create a complete trend detection and signal generation system. Unlike traditional RSI which oscillates in a separate pane, this indicator scales the RSI to price and overlays it directly on your chart, making trend analysis more intuitive.
The indicator generates clear BUY and SELL signals when the smoothed RSI crosses the OTT trailing stop line, providing actionable entry points with trend confirmation.
Originality and Purpose
This indicator is NOT a simple mashup of RSI and moving averages. It is an original implementation that transforms RSI into a trend-following overlay system:
Why VAR Smoothing? Traditional RSI is noisy and produces many false signals. The Variable Index Dynamic Average (VAR) is an adaptive smoothing algorithm based on the Chande Momentum Oscillator principle. It adjusts its smoothing factor based on market conditions - responding quickly during trends and smoothing out during choppy markets. This creates an RSI that filters noise while preserving genuine momentum shifts.
Why OTT Trailing Stop? The Optimized Trend Tracker (OTT) is a percentage-based trailing stop mechanism that only moves in the direction of the trend. When VAR-RSI crosses above OTT, a bullish trend is confirmed; when it crosses below, a bearish trend is confirmed. This provides clear, actionable signals rather than subjective interpretation.
Price Scaling Innovation: By scaling RSI (0-100) to price using the formula (RSI * close / 50), the indicator overlays directly on the price chart. This allows traders to see how momentum relates to actual price levels, making trend analysis more intuitive than a separate oscillator pane.
ATR Boundaries: Optional volatility-based boundaries show when price is extended relative to its normal range, helping identify potential reversal zones.
How the components work together:
VAR smoothing removes RSI noise while preserving trend information
OTT provides a dynamic trailing stop that generates clear crossover signals
Price scaling allows direct overlay on the chart for intuitive analysis
ATR boundaries add volatility context for profit target estimation
Core Components
1. VAR-RSI (Variable Index Dynamic Average RSI)
The foundation of this indicator is the VAR smoothing algorithm applied to RSI. VAR is an adaptive moving average that adjusts its smoothing factor based on the Chande Momentum Oscillator principle:
f_var_calc(float data, int length) =>
int a = 9
float b = data > nz(data ) ? data - nz(data ) : 0.0
float c = data < nz(data ) ? nz(data ) - data : 0.0
float d = math.sum(b, a)
float e = math.sum(c, a)
float f = nz((d - e) / (d + e))
float g = math.abs(f)
float h = 2.0 / (length + 1)
float x = ta.sma(data, length)
This creates an RSI that:
Responds quickly during trending conditions
Smooths out during choppy, sideways markets
Reduces false signals compared to raw RSI
2. OTT (Optimized Trend Tracker)
The OTT acts as a dynamic trailing stop that follows the VAR-RSI:
In uptrends, OTT trails below the VAR-RSI line
In downtrends, OTT trails above the VAR-RSI line
The OTT Percent parameter controls how closely it follows
When VAR-RSI crosses above OTT, a bullish trend is confirmed. When VAR-RSI crosses below OTT, a bearish trend is confirmed.
3. Price Scaling
The RSI (0-100 scale) is converted to price scale using:
float scaleFactor = close / 50.0
float varRSIScaled = varRSI * scaleFactor
This allows the indicator to overlay directly on price, showing how momentum relates to actual price levels.
Visual Components
VAR-RSI Line (Cyan/Magenta)
The main indicator line with gradient coloring:
Cyan gradient when RSI is above 50 (bullish)
Magenta gradient when RSI is below 50 (bearish)
Line thickness of 3 for clear visibility
OTT Line (Yellow Circles)
The trailing stop line displayed as circles:
Acts as dynamic support in uptrends
Acts as dynamic resistance in downtrends
Crossovers generate trading signals
Trend Fill
The area between VAR-RSI and OTT is filled:
Cyan fill during bullish trends
Magenta fill during bearish trends
Fill transparency allows price visibility
Buy position and LONG on Dashboard with a Uptrend:
ATR Boundaries (Optional)
Dotted lines showing volatility-based price boundaries:
Upper band: Close + (ATR x Multiplier)
Lower band: Close - (ATR x Multiplier)
Color matches current trend direction
Buy/Sell Signals
Clear labels appear at signal points:
BUY label below bar when VAR-RSI crosses above OTT
SELL label above bar when VAR-RSI crosses below OTT
Additional glow circles highlight signal bars
Bar Coloring
Optional feature that colors price bars:
Cyan bars during bullish trend
Magenta bars during bearish trend
Dashboard Panel
The 8-row dashboard provides comprehensive status information:
Signal: Current position - LONG or SHORT (large text)
VAR-RSI: Current smoothed RSI value (large text)
RSI State: OVERBOUGHT, OVERSOLD, BULLISH, or BEARISH
OTT Trend: UPTREND or DOWNTREND based on OTT direction
Bars Since: Number of bars since last signal
Price: Current close price (large text)
OTT Level: Current OTT trailing stop value
Input Parameters
RSI Settings:
RSI Length: Period for RSI calculation (default: 100)
Source: Price source (default: close)
VAR Settings:
VAR Length: Adaptive smoothing period (default: 50)
OTT Settings:
OTT Period: Trailing stop calculation period (default: 30)
OTT Percent: Distance percentage for trailing stop (default: 0.2)
ATR Trend Boundaries:
Show ATR Boundaries: Toggle visibility (default: enabled)
ATR Length: Period for ATR calculation (default: 14)
ATR Multiplier: Distance multiplier (default: 2.0)
Display Options:
Show Buy/Sell Signals: Toggle signal labels (default: enabled)
Show Status Table: Toggle dashboard (default: enabled)
Table Position: Choose corner placement
Color Bars by Trend: Toggle bar coloring (default: enabled)
Color Scheme:
Bullish Color: Main bullish color (default: cyan)
Bearish Color: Main bearish color (default: magenta)
OTT Line: Trailing stop color (default: yellow)
VAR-RSI Line: Main line color (default: teal)
ATR colors for boundaries
How to Use RSI Trend Authority
Signal-Based Trading:
Enter LONG when BUY signal appears (VAR-RSI crosses above OTT)
Enter SHORT when SELL signal appears (VAR-RSI crosses below OTT)
Use the OTT line as a trailing stop reference
Trend Confirmation:
Cyan fill indicates bullish trend - favor long positions
Magenta fill indicates bearish trend - favor short positions
Check RSI State in dashboard for momentum context
Using the Dashboard:
Monitor "Bars Since" to assess signal freshness
Check RSI State for overbought/oversold warnings
Use OTT Level as a reference for stop placement
ATR Boundaries:
Price near upper ATR band in uptrend suggests extension
Price near lower ATR band in downtrend suggests extension
Boundaries help identify potential reversal zones
Parameter Optimization
For Faster Signals:
Decrease RSI Length (try 50-80)
Decrease VAR Length (try 30-40)
Decrease OTT Period (try 15-25)
For Smoother Signals:
Increase RSI Length (try 120-150)
Increase VAR Length (try 60-80)
Increase OTT Period (try 40-50)
For Tighter Stops:
Decrease OTT Percent (try 0.1-0.15)
For Wider Stops:
Increase OTT Percent (try 0.3-0.5)
Alert Conditions
Three alert conditions are available:
Buy Signal: VAR-RSI crosses above OTT
Sell Signal: VAR-RSI crosses below OTT
Trend Change: OTT direction changes
Understanding the OTT Calculation
The OTT uses a percentage-based trailing mechanism:
float farkOTT = mavgOTT * ottPercent * 0.01
float longStopCalc = mavgOTT - farkOTT
float shortStopCalc = mavgOTT + farkOTT
longStop := mavgOTT > nz(longStop ) ? math.max(longStopCalc, nz(longStop )) : longStopCalc
shortStop := mavgOTT < nz(shortStop ) ? math.min(shortStopCalc, nz(shortStop )) : shortStopCalc
This ensures the trailing stop only moves in the direction of the trend, never against it.
Best Practices
Use on 1H timeframe or higher for more reliable signals
Wait for signal confirmation before entering trades
Consider RSI State when evaluating signal quality
Use ATR boundaries for profit target estimation
The longer RSI length (100) provides smoother trend detection
Combine with support/resistance analysis for better entries
Limitations
Signals may lag during rapid price movements due to smoothing
Works best in trending markets; may whipsaw in ranges
The overlay nature means RSI values are scaled, not absolute
Default parameters are optimized for crypto and forex; adjust for other markets
Technical Notes
This indicator is written in Pine Script v6 and uses:
VAR (Variable Index Dynamic Average) for adaptive smoothing
OTT (Optimized Trend Tracker) for trailing stop calculation
ATR for volatility-based boundaries
Gradient coloring for intuitive trend visualization
The source code is open and available for review and modification.
Disclaimer
This indicator is provided for educational and informational purposes only. It is not financial advice. Trading involves substantial risk of loss. Past performance does not guarantee future results. Always conduct your own analysis and use proper risk management.
-Made with passion by officialjackofalltrades Indicador

Indicador

Indicador

Indicador

WaveTrend MACD Fusion Oscillator [MatrixQuantLabs]WaveTrend MACD Fusion Oscillator is a composite momentum oscillator that combines WaveTrend trend structure with MACD momentum analysis in a unified panel.
It is designed to help traders better align trend strength, wave timing, and signal confirmation through normalization, filtering, and divergence analysis.
Core Concept
Instead of using the original WaveTrend histogram structure, this indicator adopts the standard MACD histogram as its momentum foundation.
This design choice allows for clearer and more reliable differentiation of trend strength, while maintaining consistency across different symbols and timeframes through normalization.
WaveTrend is then applied as a wave timing and signal layer, making the overall structure easier to interpret and more robust in varying market conditions.
Key Features
Normalized MACD for Cross-Market Consistency
• The indicator uses standard MACD parameters (12/26/9) and applies normalization to scale values into a consistent range.
• This helps avoid chart distortion across different symbols and timeframes.
• An optional “Hide Weekly+” mode is provided to prevent higher-timeframe MACD values from compressing the panel scale.
MACD Histogram with Optional MACD Lines
• The MACD histogram visually represents bullish and bearish momentum, with dynamic coloring to reflect momentum expansion or contraction.
• MACD and Signal lines can be optionally displayed when deeper analysis is required.
Divergence Detection (Regular & Hidden)
Built-in divergence detection supports both MACD lines and histogram-based divergences, with selectable modes:
• Regular Divergence for potential reversals
• Hidden Divergence for trend continuation
Pivot-based confirmation and range filters help reduce noise and false signals.
WaveTrend Oscillator with Cross Strength Classification
• The WaveTrend module consists of a main trend line and a signal line, highlighting wave structure and momentum shifts.
• Golden crosses and death crosses are classified into multiple strength levels, allowing users to distinguish minor signals from more significant ones.
• The closer a counter-directional cross occurs to the overbought or oversold zones, the stronger the potential reversal signal.
• Optional Laguerre smoothing can be enabled to reduce noise and improve signal stability.
MACD-Based Signal Filtering
WaveTrend cross signals can be filtered using MACD conditions:
• Histogram Filter: Bullish crosses only when the MACD histogram is bullish, bearish crosses only when bearish
• Zero-Line Filter: Bullish crosses only above the MACD zero line, bearish crosses only below
These filters help align wave signals with the broader momentum context and reduce counter-trend noise.
Parameter Notes
Normalization Period
• Adjust this value if the indicator appears compressed or if different symbols show inconsistent scaling.
Pivot Right
• Higher values provide stronger confirmation with more delay; lower values are more sensitive and respond faster.
Laguerre Smoothing (Gamma)
• Lower values offer stronger smoothing and stability; higher values provide faster but noisier responses.
Usage Notes
• Use WaveTrend crosses to identify wave timing and momentum shifts.
• Use MACD (histogram and zero line) to assess trend direction and momentum strength.
• Divergence signals should be treated as early warnings, not standalone trade triggers.
• Best results are achieved when combined with trend analysis, price structure, or higher-timeframe context.
Disclaimer
This indicator is intended for educational and analytical purposes only and does not constitute financial advice. Always apply proper risk management and confirm signals with additional analysis.
Indicador

Smart Signals [Vdubus]Smart Signals
Concept & Philosophy
Smart Signals is a "Regime-Filtered" oscillator designed to solve the biggest problem with standard indicators: Counter-trend noise.
Most oscillators (like Stochastic or RSI) are "dumb" to market context—they will signal "Sell" continuously during a strong uptrend simply because the price is high. Smart Signals fixes this by first determining the Market Regime (Bullish or Bearish) and then strictly filtering out any signal that contradicts that trend.
It creates a "Tiered" trading system that separates standard trend-following entries from high-probability "Sniper" entries (Hidden Divergence), all presented in a clean, color-blind-friendly visual interface.
Core Functions
1. The "Sheriff" (Trend Filter)
At the heart of the indicator is a heavy, modified Hull Moving Average (HMA 200) that acts as the trend baseline.
Bullish Regime: When the baseline is sloping UP, the indicator enters "Buy Only" mode. All Sell signals are mathematically deleted.
Bearish Regime: When the baseline is sloping DOWN, the indicator enters "Sell Only" mode. All Buy signals are mathematically deleted.
The Math: It uses a custom difference-weighted formula (wmaHalf = Length / 1) to create a stable, chop-resistant trend anchor.
2. Dual-Signal Engine
The indicator scans for two distinct types of entries simultaneously:
♦ Standard Signals (Blue/Red Diamonds):
Logic: A classic Stochastic pullback (Cross 20/80) aligned with the trend.
Use Case: These are frequent "Bread and Butter" trend entries. They are excellent for scaling into a position or adding to a winner as the trend continues.
Location: Plotted at the top (Sell) and bottom (Buy) edges of the panel.
+ Sniper Signals (Gold Crosses):
Logic: Hidden Divergence. The script detects when Price holds structure (Higher Low) while Momentum resets (Lower Low). This is a "Slingshot" setup.
Use Case: These are rare, high-conviction entries. They often mark the end of a complex correction and the resumption of the main trend.
Location: Plotted on the Zero Line to indicate structural strength.
3. Smart Momentum Histogram
The histogram visualizes the "Energy" of the move (MACD 21, 34, 7), but with a twist. It is color-coded to the signal priority:
Gold Bars: A Sniper (Divergence) setup is active.
Solid Blue/Red Bars: A Standard Signal is active.
Faded Blue/Red Bars: The trend is active, but momentum is resetting (waiting mode).
Gray Bars: Counter-trend noise (Ignore).
How to Trade It
Check the "Road": Look at the general color of the histogram columns.
Blue Columns: Look for Longs.
Red Columns: Look for Shorts.
The "Sniper" Entry: Wait for a Gold Cross (+) on the zero line. This is your primary signal to enter a trade with normal risk.
The "Pyramid" Entry: If the trend continues and you see Blue/Red Diamonds (♦) appear at the edges, these are safe places to add to your position.
The Exit: Since this is a trend-following tool, exit when the histogram color flips (e.g., from Blue to Red/Gray), or use your own support/resistance targets.
Alerts Configuration
The indicator comes with a full suite of alerts for automation:
Gold Buy / Gold Sell: Notifies you only for the high-probability Hidden Divergence setups.
Standard Buy / Standard Sell: Notifies you for every trend pullback.
ANY BUY / ANY SELL: A combo alert that triggers on either signal type (useful for simplifying your alert limits).
Accessibility
Color Blind Friendly: The default palette uses High-Contrast Blue (#2962FF) and Soft Red (#FF5252) instead of standard Green/Red, ensuring visibility for all users.
Zero Clutter: No text labels or confusing lines. Just clear, distinct shapes (Diamonds and Crosses) at fixed locations. Indicador

Indicador

Indicador

Indicador

deKoder | Structural Flow [SF]deKoder | SF | Structural Flow - Swing/Pivot Structure Charting
Strips away the noise of standard candlestick charts and reveals the true underlying swing structure through clean, connected pivot lines.
Beneath the storm of wicks / Silent structure whispers truth
Extreme Noise Reduction
Replaces cluttered price action with a minimalist pivot based line chart. The user-defined Window length lets you control sensitivity: shorter for more detail on lower timeframes, longer for cleaner structure on higher timeframes.
Accurate Swing Detection
Only stronger pivots are accepted. Weaker same side pivots are ignored, preserving the true extreme highs and lows without distortion.
Real Time Extension
The final incomplete leg dynamically follows the current close until the next confirmed pivot forms.
Optional Directional Colouring
Enable Directional Colouring to automatically colour confirmed legs with the user defined bull and bear colours on upward and downward swings.
Adjustable Background Candles
Candles with adjustable transparency may be displayed on the chart. Adjust the visibility setting to find the perfect balance between full raw candle data and clean structure
Practical Uses
Instantly reveals classic chart patterns — head & shoulders, double tops/bottoms, triangles, flags with unmistakable clarity
Becomes simple to spot Wyckoff springs, upthrusts, and phase transitions inside trading ranges
Provides a clean foundation for manual Elliott Wave counting . Clear swing structure makes labeling impulses and corrections much easier
Makes trend changes and potential reversals stand out without second-guessing every wick
Excellent for higher-timeframe structural analysis — the longer window setting produces exceptionally clean swing views
Ideal for creating clean educational screenshots and annotated posts - the chart speaks for itself
Reduces emotional noise by shifting focus from every candle to meaningful swing structure
Well suited for swing and price action traders, Wyckoff and Elliott Wave analysis, and anyone who prefers calm, uncluttered charts over constant visual chaos.
Clean charts. Clear sight.
☠ FR33FA11 | deKoder ☠
Released January 2025 | Open Source
If this open-source script (or any of its free companions) has saved you time or helped you read the market better, a coffee or a few sats helps to keep the Pine coming ❤️
Solana: 2N8HWPAHSC7Z8SLyneMrZp234UAP9HCtQX7wNXw7LKQC
Ethereum: 0xE770D254DC579d1db7bA2fe74376b7009527356B
Bitcoin: bc1qd8j3awht5yrjtnvt5dagxldzhaesc83sftype3
Polygon: 0xE770D254DC579d1db7bA2fe74376b7009527356B
Hype: 0xE770D254DC579d1db7bA2fe74376b7009527356B Indicador

Indicador

Moving Average Structure ZigZag [Stable & Filtered]
(日本語説明)
このインジケーターは、移動平均線(MA)の転換に基づき、相場の「真の構造」を可視化するために開発されました。 通常のZigZagのように価格の単純な反転に依存せず、「MAのトレンド転換 + 指定した値幅の到達」という2つの条件を用いることで、レンジ相場の細かなノイズ(ダマシ)を排除し、ダウ理論に基づいた重要な高値・安値だけを結びます。
💡 主な機能
MAタイプの切り替え: SMA, EMA, HMA, VW-HMAなど、目的に合わせたトレンド感度を選択可能。
値幅フィルター(Min Deviation): 添付画像のように、小さな値動きをカットし、大きな市場構造だけを抽出します。
価格アクションへの追従: ラインはMAの数値ではなく、期間内の実最高値・最安値を正確に結び、高値更新時には自動で延伸されます。
🛠 活用シーン
環境認識: 上位足での大きな波形を確認し、現在のフェーズを定義。
ノイズ除去: 市場の主要な節目(レジサポ候補)の特定。
ダウ理論の視覚化: 高値・安値の切り上がり・切り下がりを明確化。
(English Description)
This indicator was developed to visualize the "True Market Structure" based on Moving Average (MA) reversals. Unlike standard ZigZag which relies solely on price reversals, this tool combines MA Trend Reversals and a Minimum Deviation filter to eliminate market noise and highlight significant swing highs and lows based on Dow Theory.
💡 Key Features
Multiple MA Types: Select from SMA, EMA, HMA, VW-HMA, etc., to match your preferred trend sensitivity.
Min Deviation Filter: As shown in the attached image, it filters out minor price fluctuations to extract only the major market waves.
Price Action Tracking: The lines connect the actual High/Low prices within the period, not the MA values themselves. Lines automatically extend when a trend continues to new highs/lows.
🛠 Use Cases
Market Context: Identify major wave patterns on higher timeframes to define the current phase.
Noise Reduction: Pinpoint key market levels and potential support/resistance.
Dow Theory Visualization: Clearly visualize higher highs/lows and trend shifts.
Settings
MA Type: Choose the type of Moving Average.
Moving Average Length: The lookback period for structure.
Min Deviation (Pips): The threshold to filter noise. Adjust according to the volatility of the pair.
Indicador

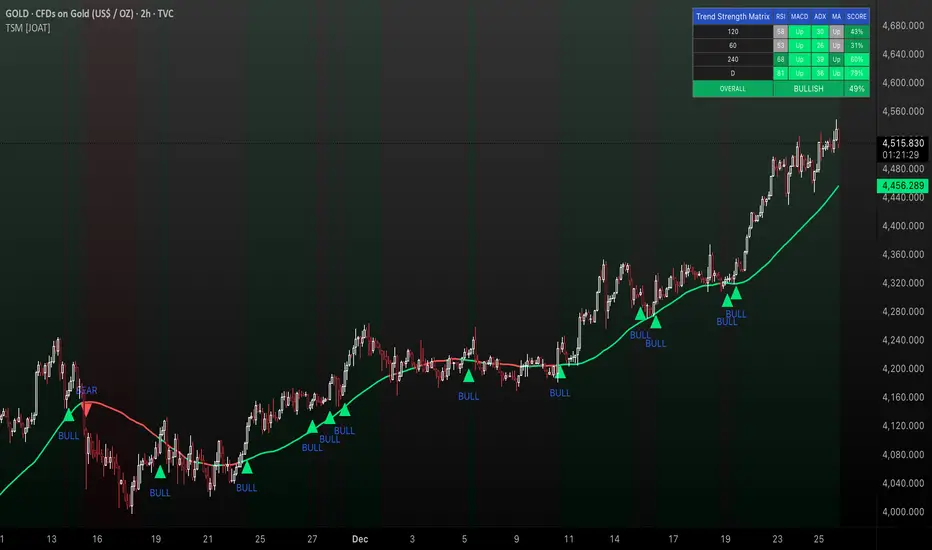
Trend Strength Matrix [JOAT]Trend Strength Matrix — Multi-Timeframe Confluence Analysis System
This indicator addresses a specific analytical challenge: how to efficiently compare multiple technical measurements across different timeframes while accounting for their varying scales and interpretations. Rather than managing separate indicator windows with different scales, this tool normalizes four distinct analytical approaches to a common -1 to +1 scale and presents them in a unified matrix format.
Why This Combination Adds Value
The core problem this indicator solves is analytical fragmentation. Traders often use multiple indicators but struggle with:
1. **Scale Inconsistency**: RSI ranges 0-100, MACD has no fixed range, ADX ranges 0-100 but measures strength not direction
2. **Timeframe Coordination**: Checking multiple timeframes requires switching between charts or cramming multiple indicators
3. **Cognitive Load**: Processing different indicator types simultaneously creates mental overhead
4. **Confluence Assessment**: Determining when multiple approaches agree requires manual comparison
This indicator specifically addresses these issues by creating a standardized analytical framework where different measurement approaches can be directly compared both within and across timeframes.
Originality and Technical Innovation
While the individual components (RSI, MACD, ADX, Moving Average) are standard, the originality lies in:
1. **Unified Normalization System**: Each component is mathematically transformed to a -1 to +1 scale using component-specific normalization that preserves the indicator's core characteristics
2. **Multi-Timeframe Weighting Algorithm**: Higher timeframes receive proportionally more weight (40% current, 25% next, 20% third, 15% fourth) based on the principle that longer timeframes provide more significant context
3. **Real-Time Confluence Scoring**: The composite calculation provides an instant assessment of how much the different analytical approaches agree
4. **Adaptive Visual Encoding**: The heatmap format allows immediate pattern recognition of agreement/disagreement across both indicators and timeframes
How the Components Work Together
Each component measures a different aspect of market behavior, and their combination provides a more complete analytical picture:
**Momentum Component (RSI-based)**: Measures the velocity of price changes by comparing average gains to losses
**Trend Component (MACD-based)**: Measures the relationship between fast and slow moving averages, indicating trend acceleration/deceleration
**Strength Component (ADX-based)**: Measures trend strength regardless of direction, then applies directional bias
**Position Component (MA-based)**: Measures price position relative to a reference average
The mathematical relationship between these components creates a comprehensive view:
- When all four agree (similar colors), it suggests multiple analytical approaches are aligned
- When they disagree (mixed colors), it highlights analytical uncertainty or transition periods
- The composite score quantifies the degree of agreement numerically
Detailed Component Analysis
**1. Momentum Oscillator Component**
This component transforms RSI into a centered oscillator by subtracting 50 and dividing by 50, creating a -1 to +1 range where 0 represents equilibrium between buying and selling pressure.
// Momentum calculation normalized to -1 to +1 scale
float rsi = ta.rsi(close, rsiLength)
float rsiScore = (rsi - 50) / 50
// Result: 0 at equilibrium, +1 at extreme overbought, -1 at extreme oversold
**2. Moving Average Convergence Component**
MACD is normalized by its own volatility (standard deviation) to create a bounded oscillator. This prevents the unbounded nature of MACD from dominating the composite calculation.
// MACD normalized by its historical volatility
= ta.macd(close, macdFast, macdSlow, macdSignal)
float macdStdev = ta.stdev(macdLine, 100)
float macdScore = macdStdev != 0 ? math.max(-1, math.min(1, macdLine / (macdStdev * 2))) : 0
**3. Directional Movement Component**
This combines ADX (strength) with directional movement (+DI vs -DI) to create a directional strength measurement. ADX alone shows strength but not direction; this component adds directional context.
// ADX-based directional strength
= calcADX(adxLength)
float adxStrength = math.min(adx / 50, 1) // Normalize ADX to 0-1
float adxDirection = plusDI > minusDI ? 1 : -1 // Direction bias
float adxScore = adxStrength * adxDirection // Combine strength and direction
**4. Price Position Component**
This measures price deviation from a moving average, weighted by the magnitude of deviation to distinguish between minor and significant displacements.
// Price position relative to moving average
float ma = ta.sma(close, maLength)
float maDirection = close > ma ? 1 : -1
float maDeviation = math.abs(close - ma) / ma * 10 // Percentage deviation scaled
float maScore = math.max(-1, math.min(1, maDirection * math.min(maDeviation, 1)))
Multi-Timeframe Integration Logic
The multi-timeframe system uses a weighted average that gives more influence to higher timeframes:
// Timeframe weighting system
float currentTF = composite * 0.40 // Current timeframe: 40%
float higherTF1 = composite_tf2 * 0.25 // Next higher: 25%
float higherTF2 = composite_tf3 * 0.20 // Third higher: 20%
float higherTF3 = composite_tf4 * 0.15 // Fourth higher: 15%
float multiTFComposite = currentTF + higherTF1 + higherTF2 + higherTF3
This weighting reflects the principle that higher timeframes provide more significant context for market direction, while lower timeframes provide timing precision.
What the Dashboard Shows
The heatmap displays a grid where:
Each row represents a timeframe
Each column shows one component's normalized reading
Colors indicate the value: green shades for positive, red shades for negative, gray for neutral
The rightmost column shows the composite average for that timeframe
Visual Elements
Moving Average Line — A simple moving average plotted on the price chart
Background Tint — Subtle coloring based on the composite score
Shift Labels — Markers when the composite crosses threshold values
Dashboard Table — The main heatmap display
Inputs
Calculation Parameters:
Momentum Length (default: 14)
MACD Fast/Slow/Signal (default: 12/26/9)
Directional Movement Length (default: 14)
Moving Average Length (default: 50)
Timeframe Settings:
Enable/disable multi-timeframe analysis
Select additional timeframes to display
How to Read the Display
Similar colors across a row indicate the components are showing similar readings
Mixed colors indicate the components are showing different readings
The composite percentage shows the average of all four components
Alerts
Composite crossed above/below threshold values
Strong readings (above 50% or below -50%)
Important Limitations and Realistic Expectations
This indicator displays current analytical conditions—it does not predict future price movements
Agreement between components indicates current analytical alignment, not future price direction
All four components are based on historical price data and inherently lag price action
Market conditions can change rapidly, making current readings irrelevant
Different parameter settings will produce different readings and interpretations
No combination of technical indicators can reliably predict future market behavior
Strong readings in one direction do not guarantee continued movement in that direction
The composite score reflects mathematical relationships, not market fundamentals or sentiment
This tool should be used as one input among many in a comprehensive analytical approach
Appropriate Use Cases
This indicator is designed for:
- Analytical organization and efficiency
- Multi-timeframe confluence assessment
- Pattern recognition in indicator relationships
- Educational study of how different analytical approaches relate
- Supplementary analysis alongside other methods
This indicator is NOT designed for:
- Standalone trading signals
- Guaranteed profit generation
- Market timing precision
- Replacement of fundamental analysis
- Automated trading systems
— Made with passion by officialjackofalltrades
Indicador

Indicador

Indicador

Indicador

Indicador
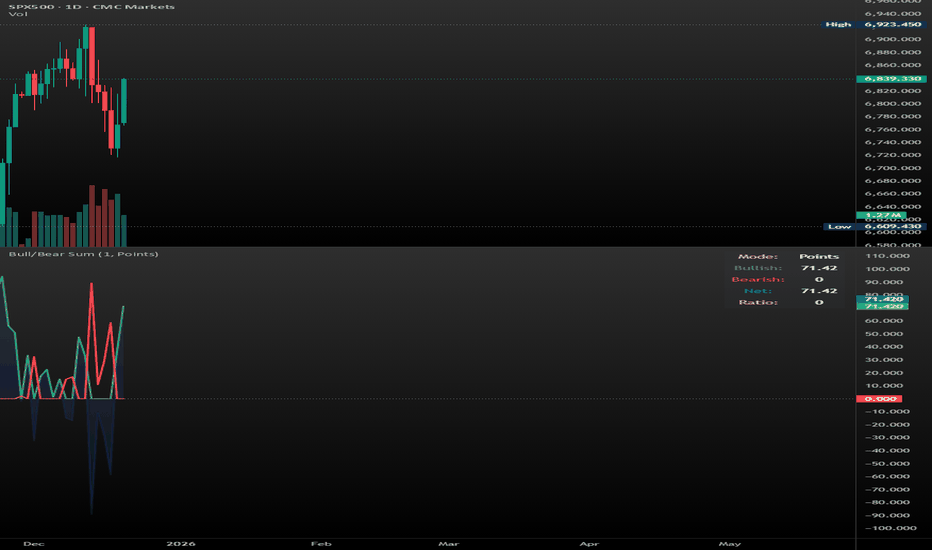
CS Trendline ProTitle: CS Trendline Pro
Description:
CS Trendline Pro is a comprehensive scalping and day-trading system designed to filter out noise and identify high-probability breakout setups. It combines the structural precision of Fractal Trendlines with a robust Dual-EMA Filter, visualized through an intuitive "Traffic Light" color system.
This tool is specifically engineered for traders who want to trade Trendline Breakouts but need a safety mechanism to avoid false signals (fakeouts) and counter-trend traps.
🚦 How the "Traffic Light" Logic Works
The core feature of this script is the dynamic coloring of the candles, which acts as a visual filter for your entries:
🟢 GREEN Zone (Safe Buy):
Condition: A Bullish Trendline Breakout has occurred AND the price is holding ABOVE the EMA 30 (Yellow Line).
Meaning: Momentum is bullish, and you are in a safe zone to look for Long entries.
🔴 RED Zone (Safe Sell):
Condition: A Bearish Trendline Breakout has occurred AND the price is holding BELOW the EMA 30 (Yellow Line).
Meaning: Momentum is bearish, and you are in a safe zone to look for Short entries.
⚪ GRAY Zone (No Trade / Wait):
Condition: A breakout occurred, but the price is on the "wrong side" of the EMA 30.
Meaning: Indecision. The market structure is conflicting with the immediate momentum. It is recommended to stay out until the color changes.
🛠️ Key Features
** automated Trendlines:** Automatically draws Support and Resistance dynamic trendlines based on pivot points (LuxAlgo engine).
Dual EMA Filter:
EMA 30 (Yellow): Acts as the immediate "Safe Zone" filter.
EMA 200 (White): Displays the macro trend. (Pro Tip: Only take Green signals if price is above the White line).
CS-BUY / CS-SELL Labels: Clear text markers appear exactly when a valid breakout occurs.
Customizable: Adjustable sensitivity (Length), EMA periods, and Slope calculation methods (ATR, Stdev, Linreg).
📉 How to Trade with CS Trendline Pro
For Scalping (5m / 15m):
Identify the Main Trend: Look at the White EMA (200).
If Price > EMA 200 → Focus on BUY signals.
If Price < EMA 200 → Focus on SELL signals.
Wait for the Signal:
Wait for the candle to turn Teal (Green) or Red.
Ensure the candle closes with the new color.
Risk Management:
Place Stop Loss below the recent swing low (for buys) or above the swing high (for sells).
Target a 1.5 Risk/Reward ratio or trail your stop using the EMA 30.
⚠️ Important Note on Backpainting
This indicator uses pivot points to draw trendlines. By nature, a pivot point can only be confirmed after a few bars have passed (Lag).
Backpaint Setting (Default ON): Keeps your historical chart clean by connecting the exact pivot points in the past.
Real-Time Behavior: In live trading, the trendline and signal will appear once the pivot is confirmed (based on your 'Length' setting). This is normal behavior for any trendline script.
Settings Recommended:
5-Minute Chart: Length 10 or 14.
15-Minute Chart: Length 14.
Enjoy trading with precision! ~ CS Trading Indicador

JK Scalp - Nishith RajwarJK Scalp Nishith Rajwar
Multi-Stochastic Rotation & Momentum Scalping Framework
JK Scalp is a rule-based momentum and rotation oscillator designed for short-term scalping and intraday execution.
It focuses on how momentum rotates across multiple stochastic speeds, instead of relying on a single oscillator or lagging averages.
This is an execution aid, not a predictive indicator.
🧠 Concept & Originality
Unlike standard stochastic tools, JK Scalp uses four synchronized stochastic layers:
• Fast (9,3) → execution timing
• Medium (14,3) → structure confirmation
• Slow (44,3) → swing context
• Trend (60,10,10) → dominant momentum regime
The core idea is quad-rotation:
High-probability trades occur when all momentum layers rotate together after reaching an extreme.
This script combines:
• Momentum rotation
• Divergence logic
• Flag continuation logic
• Trend-state filtering
into a single cohesive framework, not a simple indicator mashup.
📊 How to Use (Step-by-Step)
1️⃣ Best Timeframes
• Scalping: 1m – 3m
• Intraday: 5m – 15m
• Avoid higher timeframes (not designed for swing holding)
Works best on:
• Index options
• Index futures
• Highly liquid stocks
• Crypto majors
2️⃣ Understanding the Signals
🔁 Quad Rotation (Core Signal)
A valid rotation requires:
• Fast, Medium, Slow, and Trend stochastic moving in the same direction
• Momentum exiting Overbought / Oversold zones
• Trend stochastic supporting the move
This filters out random oscillator noise.
3️⃣ Entry Conditions
🟢 LONG Setup
• Bullish quad rotation
• Either:
– Bullish divergence OR
– Bullish flag pullback
• Fast stochastic turning up
🔴 SHORT Setup
• Bearish quad rotation
• Either:
– Bearish divergence OR
– Bearish flag pullback
• Fast stochastic turning down
⚠️ Signals are confirmation-based, not anticipatory.
4️⃣ SUPER LONG / SUPER SHORT
These appear only when:
• Quad rotation
• Divergence confirmation
They represent high-confidence momentum inflection zones, not guaranteed reversals.
5️⃣ Stop-Loss Visualization
Optional SL zones are plotted using:
• Recent swing high / low
• ATR-based buffer (configurable)
This helps traders visualize risk, not automate exits.
🎨 Visual System (Why It Looks Different)
• Multi-layer glow effects → momentum strength
• Dynamic cloud → fast vs trend dominance
• Color-shifting fast line → acceleration vs decay
• Chart overlays → execution clarity without clutter
Everything is designed for speed and readability during live trading.
⭐ Unique Selling Points (USP)
✅ Multi-speed stochastic rotation (not single-line signals)
✅ Context-first, not signal spam
✅ Built-in divergence + continuation logic
✅ Non-repainting logic
✅ Designed for scalpers, not hindsight analysis
✅ Works across indices, options, crypto, and futures
⚠️ Important Notes
• Not a standalone trading system
• Best combined with:
– Market structure
– Key levels
– Session timing
• Avoid low-liquidity or news-spike candles
This indicator guides execution, it does not replace discretion.
👤 Who This Is For
• Scalpers & intraday traders
• Options traders needing precise timing
• Traders who understand momentum & structure
• Users who want fewer but higher-quality signals
🏁 Summary
JK Scalp helps you trade momentum rotation, not overbought/oversold myths.
Wait for alignment. Execute with discipline. Indicador

Dynamic MAs Zscore | Lyro RSThe Dynamic MAs Zscore is an adaptive momentum and valuation oscillator built around advanced moving averages and statistical Z-Score normalization. By combining a wide selection of moving average types with dynamic deviation bands, this indicator delivers clear insights into trend strength , directional bias , and relative valuation — all in a clean, visually intuitive format.
━━━━━━━━━━━━━━━
Key Features
━━━━━━━━━━━━━━━
Dynamic Moving Average Engine
Applies one of 12 selectable moving average types (SMA, EMA, WMA, VWMA, HMA, ALMA, TEMA, etc.) to the chosen source. This allows fine-tuning between responsiveness and smoothness depending on market conditions.
Z-Score Normalization
Transforms the selected moving average into a standardized Z-Score:
(MA − mean) / standard deviation
This normalization makes momentum strength comparable across assets and timeframes.
Adaptive Deviation Bands
Upper and lower bands are derived from the rolling standard deviation of the Z-Score:
Custom band length
Independent positive and negative multipliers
These bands dynamically expand and contract with volatility.
Dual Signal Modes
Trend Mode – Focuses on directional continuation. Color changes and signals occur when Z-Score breaks above or below deviation bands.
Valuation Mode – Highlights relative overvaluation and undervaluation using a gradient color scale and predefined value zones.
Advanced Visual System
Includes bold layered plots, gradient fills, background shading, and candle/bar coloring to clearly reflect current market state.
Custom Color Palettes
Choose from multiple preset themes (Classic, Mystic, Accented, Royal) or define your own bullish and bearish colors.
━━━━━━━━━━━━━━━
How It Works
━━━━━━━━━━━━━━━
MA Calculation – The selected moving average type is applied to the chosen price source.
Z-Score Computation – The MA is normalized over a user-defined lookback period to quantify deviation from its mean.
Band Construction – Standard deviation of the Z-Score is calculated over the band length and scaled by positive/negative multipliers.
Mode-Dependent Logic
Trend Mode – Breaks above the upper band signal bullish momentum; breaks below the lower band signal bearish momentum.
Valuation Mode – A gradient reflects relative valuation from undervalued to overvalued, with background highlights at extreme Z-Score levels.
━━━━━━━━━━━━━━━
Signal Interpretation
━━━━━━━━━━━━━━━
Trend Confirmation
In Trend Mode, sustained moves beyond deviation bands indicate strong directional bias.
Momentum Strength
The distance of the Z-Score from zero reflects the intensity of trend momentum.
Relative Valuation
In Valuation Mode, deep negative Z-Scores suggest undervaluation, while high positive Z-Scores suggest overvaluation.
Visual Clarity
Bar and candle coloring aligned with oscillator state allows for rapid assessment of market conditions.
━━━━━━━━━━━━━━━
Customization
━━━━━━━━━━━━━━━
Adjust MA type and length to balance speed vs. smoothness.
Modify Z-Score length to control sensitivity.
Tune band length and multipliers for volatility adaptation.
Switch between Trend and Valuation modes depending on strategy.
Personalize visuals using preset or custom color palettes.
━━━━━━━━━━━━━━━
Alerts
━━━━━━━━━━━━━━━
Bullish condition when Z-Score > 0
Bearish condition when Z-Score < 0
Overvalued and undervalued valuation alerts
⚠️ Disclaimer
This indicator is intended for technical analysis and educational purposes only. It does not guarantee profitable outcomes and should be used alongside other tools, confirmation methods, and sound risk management. The author is not responsible for any financial decisions made using this indicator. Indicador

Structure Pivot (LL-HL / HH-LH)Structure Pivot (LL-HL / HH-LH) - Indicator Guide
This indicator scans for market structure pivot patterns—specifically the bullish Higher Low (LL–HL) and the bearish Lower High (HH–LH) —across multiple lengths simultaneously.
It automatically selects the most optimal pattern based on a "Priority Mode" and plots the structure and breakout/breakdown levels on the chart.
1. Basic Calculation Method
The indicator builds upon TradingView’s ta.pivotlow and ta.pivothigh functions to identify structural points.
Bullish Structure (LL–HL)
1.LL (Lowest Low): A standard Pivot Low is identified.
2.HL (Higher Low): A subsequent Pivot Low forms higher than the previous LL. This completes the setup.
3.Pivot Line (Resistance): The indicator finds the highest price (High) that occurred between the LL and the HL. This level becomes the breakout trigger.
Bearish Structure (HH–LH)
1.HH (Highest High): A standard Pivot High is identified.
2.LH (Lower High): A subsequent Pivot High forms lower than the previous HH. This completes the setup.
3.Pivot Line (Support): The indicator finds the lowest price (Low) that occurred between the HH and the LH. This level becomes the breakdown trigger.
2. Multi-Length Scanning
Unlike standard indicators that use a single fixed length (e.g., Length = 5), this indicator scans a range of lengths simultaneously.
・Settings: Defined by Min Length and Max Length.
・Mechanism: If set to Min=2 and Max=10, the indicator internally runs 9 separate calculations (Length 2 through 10) in parallel.
This allows it to capture everything from small, short-term pullbacks to larger, significant structural pivots without manual adjustment.
3. Priority Mode System
Since multiple lengths are scanned, multiple valid patterns may appear at the same time. The Priority Mode determines which single pattern is the "winner" and gets displayed.
A. Tightest Structure (Default)
・For Bullish (Long): Selects the pattern with the lowest Pivot Line (Resistance).
・For Bearish (Short): Selects the pattern with the highest Pivot Line (Support).
・Advantage: It finds the "tightest" contraction (like a VCP). This offers the entry point closest to the stop-loss level, providing the best Risk/Reward ratio.
B. Longest Length
・Selects the pattern detected by the longest length setting.
・Advantage: Focuses on major structural points, filtering out short-term noise. Best for trend confirmation.
C. Shortest Length
・Selects the pattern detected by the shortest length setting.
・Advantage: Extremely sensitive. Best for scalping or catching immediate micro-pullbacks.
4. Real-Time Logic & Features
Structure Invalidation (Failure)
・Bullish: If the current price drops below the HL (the support of the structure), the setup is considered failed.
・Bearish: If the current price rises above the LH (the resistance of the structure), the setup is considered failed.
・Result: All lines and labels for that structure are immediately deleted to keep the chart clean.
Pivot Line Extension
・As long as the structure remains valid (price hasn't violated the HL or LH), the Pivot Line extends to the right, acting as a live reference for breakouts or breakdowns.
Alerts
・Bullish Breakout: Triggered when the Close price crosses over the Pivot Line.
・Bearish Breakdown: Triggered when the Close price crosses under the Pivot Line. Indicador

FxAST Trend Force [ALLDYN]Attribution
This indicator is based on the original Trend Speed Analyzer created by Zeiierman .
FxAST Trend Force is a modified and simplified derivative that preserves the core methodology while focusing on clarity, usability, and practical trend interpretation .
This indicator is intended for educational and analytical use. Derivative works must retain attribution and license terms.
__________________________________________________________________________________
FxAST Trend Force
Overview
FxAST Trend Force is a directional pressure indicator designed to show who is in control of the market and how strong that control is, in real time.
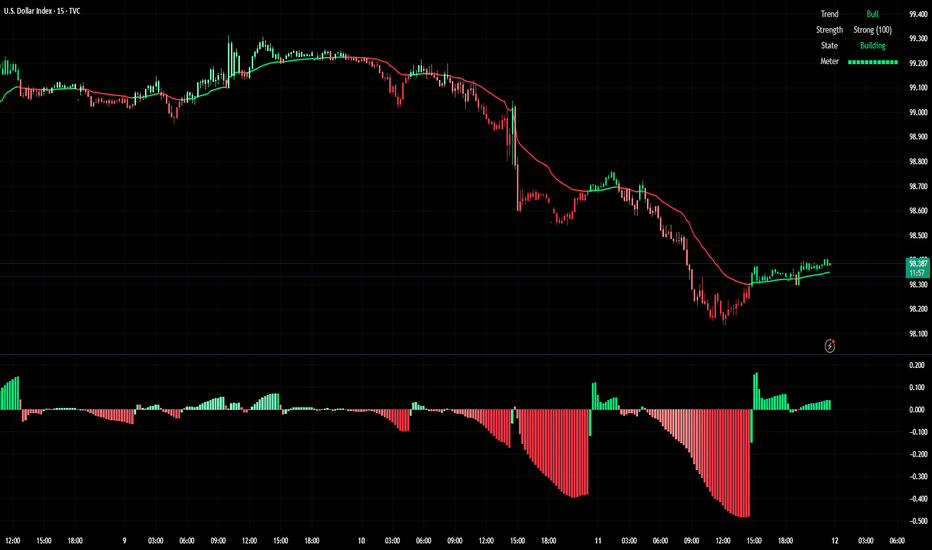
Instead of measuring raw price speed or traditional momentum, this tool focuses on trend force — the sustained push of price relative to a dynamic trend baseline. The result is a clean, intuitive view of trend direction, strength, and condition without complex math or hard-to-interpret ratios.
This indicator is best used as a trend confirmation and trade management tool , not a standalone signal generator.
_________________________________________________________________________________
How It Works
FxAST Trend Force uses a Dynamic Moving Average (DMA) that adapts to changing market conditions. Price behavior relative to this adaptive trend line determines the current trend regime.
While price remains on one side of the trend:
Directional pressure accumulates
Strength builds or weakens
The regime resets only when price decisively crosses the trend
This creates a clear visual representation of trend persistence vs exhaustion , rather than short-term noise.
__________________________________________________________________________________
Core Concepts (Plain English)
Trend
Shows the current directional bias:
Bull → price above the dynamic trend
Bear → price below the dynamic trend
This answers: “Which side is currently in control?”
__________________________________________________________________________________
Strength
Displays how strong the current trend pressure is on a 0–100 scale , normalized to recent market conditions.
Strength is shown both as:
A simple label: Weak / Normal / Strong
A visual meter for quick interpretation
This answers: “Is this move weak, average, or meaningful?”
__________________________________________________________________________________
State
Indicates whether trend force is:
Building → pressure increasing
Fading → pressure weakening
This answers: “Is the trend gaining energy or losing it?”
__________________________________________________________________________________
Visual Meter
A compact bar at the bottom of the table represents trend force intensity at a glance.
Longer bar → stronger sustained pressure
Shorter bar → weaker or stalling trend
No ratios. No multipliers. Just visual clarity.
__________________________________________________________________________________
How to Use
Trend Confirmation
Favor longs when Trend = Bull and Strength = Normal/Strong
Favor shorts when Trend = Bear and Strength = Normal/Strong
__________________________________________________________________________________
Trade Management
Building state supports continuation
Fading state warns of exhaustion, consolidation, or potential reversal
__________________________________________________________________________________
Filtering Noise
Weak strength often signals chop or low-quality conditions
Strong force helps filter false breakouts
__________________________________________________________________________________
Settings (Simplified)
Maximum Length
Controls how smooth or responsive the dynamic trend is.
Accelerator Multiplier
Adjusts how quickly the trend adapts to price changes.
Lookback Period
Defines the window used to normalize trend force.
Enable Candles
Colors price candles by trend force for visual clarity.
Show Simple Table
Toggles the Trend / Strength / State display.
__________________________________________________________________________________
Philosophy
FxAST Trend Force is intentionally not a signal-spamming indicator.
It is designed to reduce cognitive load , not increase it.
If you need:
exact entries → use price action
exact exits → use structure
context and confirmation → use Trend Force
__________________________________________________________________________________
Disclaimer
This indicator is provided for educational purposes only and does not constitute financial advice. Trading involves risk, and users are responsible for their own decisions.
Indicador