Understanding range charts
Range bars eliminate time as a source for constructing chart elements and are widely used for high-frequency trading. A new bar here is formed when prices reach a certain value set by the user.
CONTENTS:
What are range bars?
Range bars are price-based charts, meaning they don't factor in time. A new bar appears only when the price moves to the particular value regardless of how much time has passed. That's why, in contrast to most other commonly used chart types — such as candles, line, or time-based bars — range bars may appear with different time intervals.
You can choose different price ranges, at which new bars will appear.
1 range always equals one minimum price change, i.e., one tick.
Range bars vs standard bars
These two chart types are completely different, as they are price-based and time-based.
Range bars
- A new chart element appears only when a price moves by a minimum value in ticks
- More suited for short-term trading
- May provide a clearer picture of support and resistance levels
Standard bars
- A new chart element appears when a particular amount of time passes
- More informative in displaying the battle between buyers and sellers over a significant period of time
- Work better with chart patterns
How to enable range bars
You can select this chart type using one of the two methods:
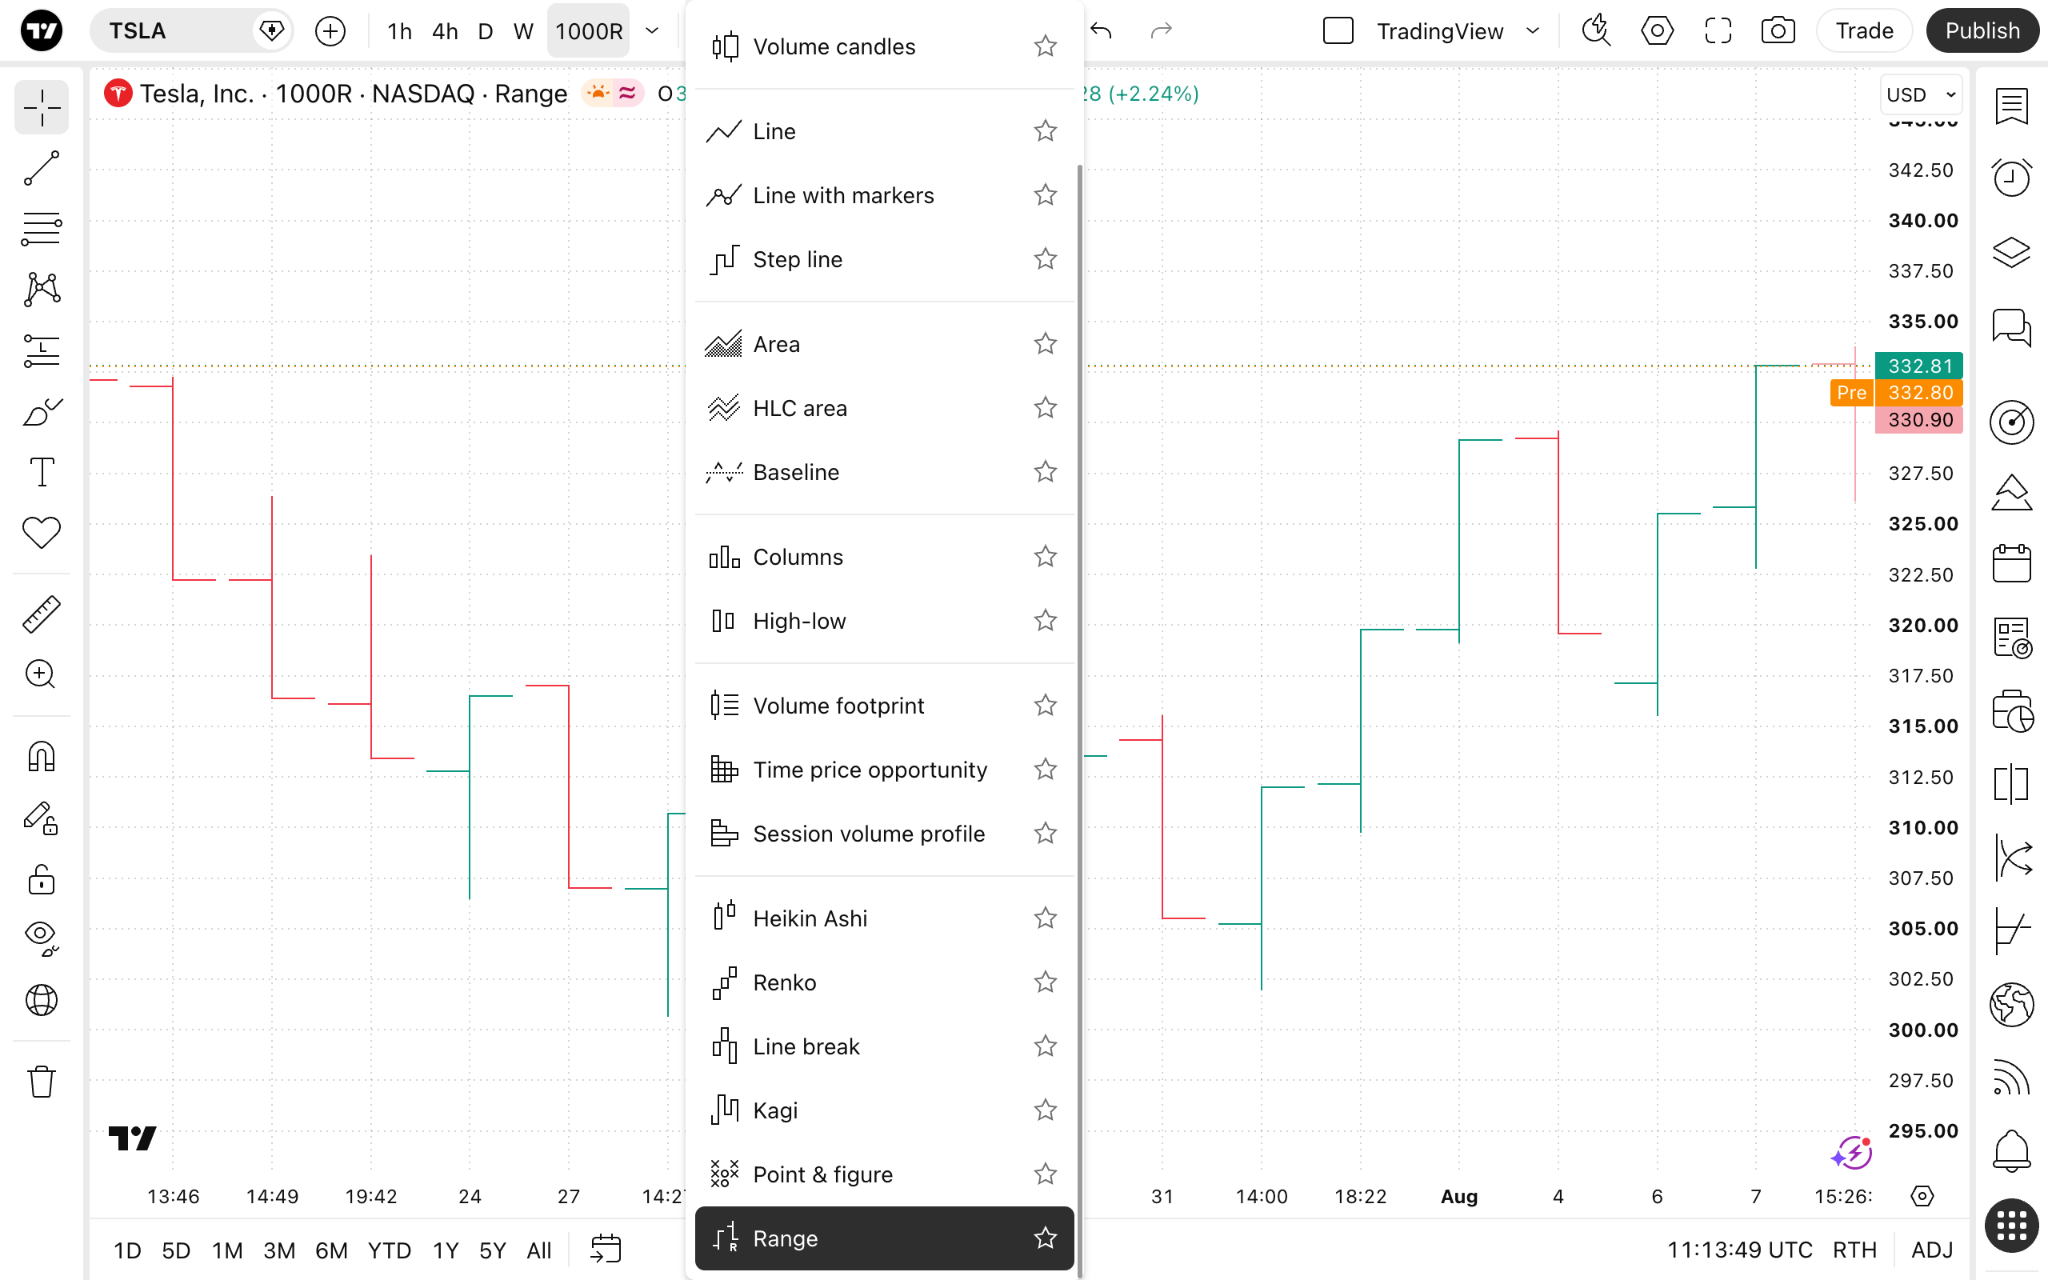
- Select "Range" in the chart type menu.
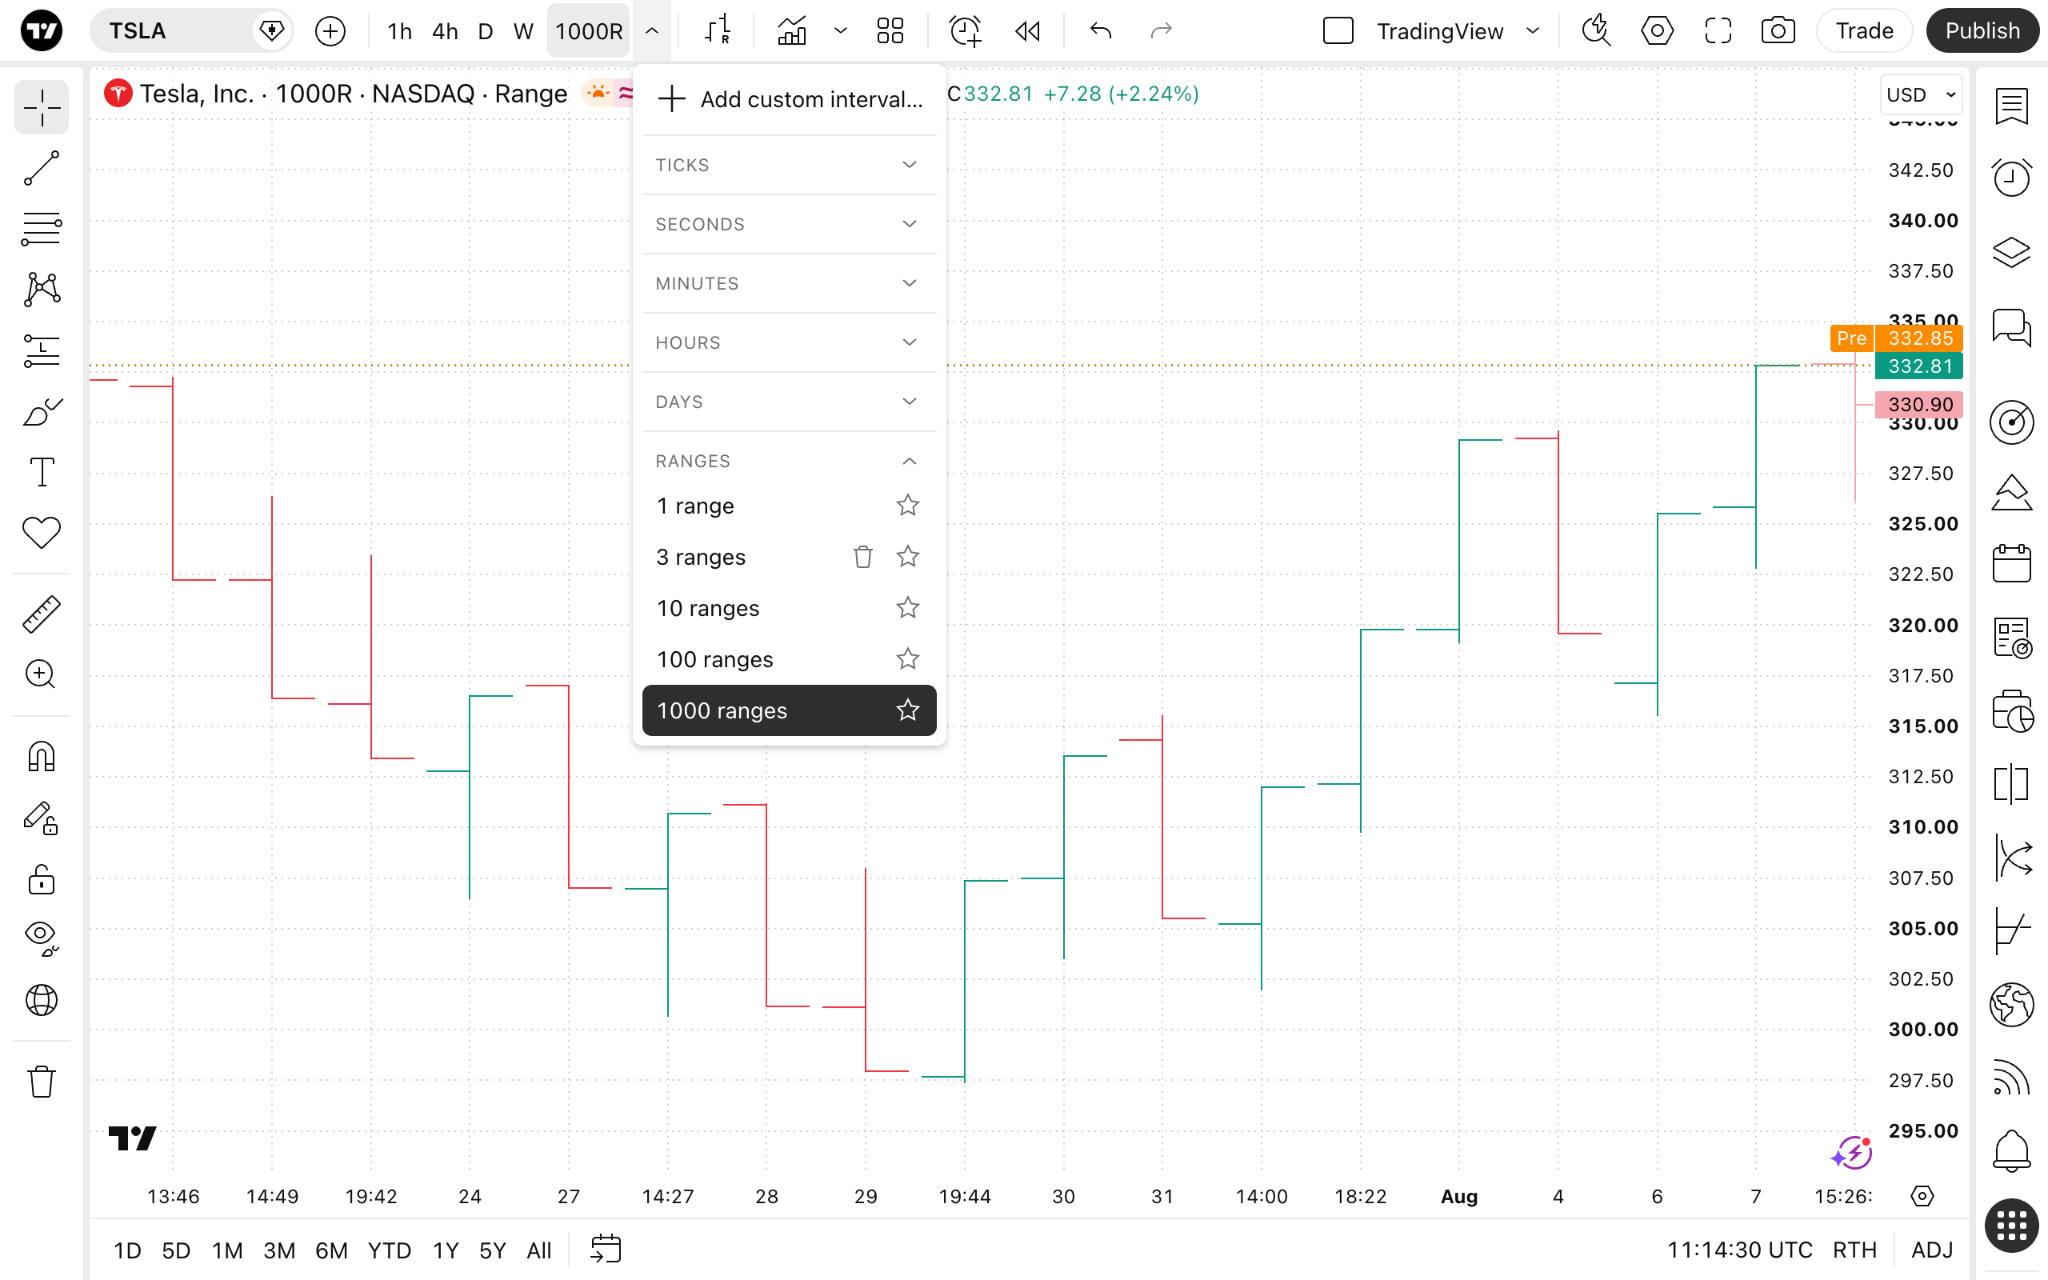
- Select one of the range intervals in the "Chart interval" dropdown.
Range bars settings
You can choose either of the two general styles — bars or candles.
If you prefer bars, you can configure:
- Up bars: Set the color of the up bar.
- Down bars: Set the color of the down bar.
- Projection up bars: Set the color of the projection up bar.
- Projection down bars: Set the color of the projection down bar.
Projection bars are those that are built based on the data of the currently forming bar.
Choose Thin bars if you prefer them thin or untick it to make them bold.
The Phantom bars setting fills untraded price gaps with virtual bars.
If you prefer range chart type to be displayed as candles, you can change the following settings:
- Body: Set the color of the up/down candle body.
- Borders: Set the color of the up/down candle border.
- Wick: Set the color of the up/down candle wick.
- Projection candles: Set the color of the up/down projection candles.
Range charts in a nutshell
Range bars and intervals can enhance your strategy if you're focused on price only. This chart type may give you a clear picture of support and resistance levels.
Also read: