
Parabolic SAR Positioned at $0.0001714, indicating a bullish trend reversal.
MACD The histogram is positive at $0.0000055, with the MACD line at -$0.0000102 and the signal line at -$0.0000157, suggesting a potential bullish momentum.
Stochastic (%K) At 81.74, indicating overbought conditions.
RSI At 51.33, which is in the neutral zone but trending upwards.
Key Levels and Trends:
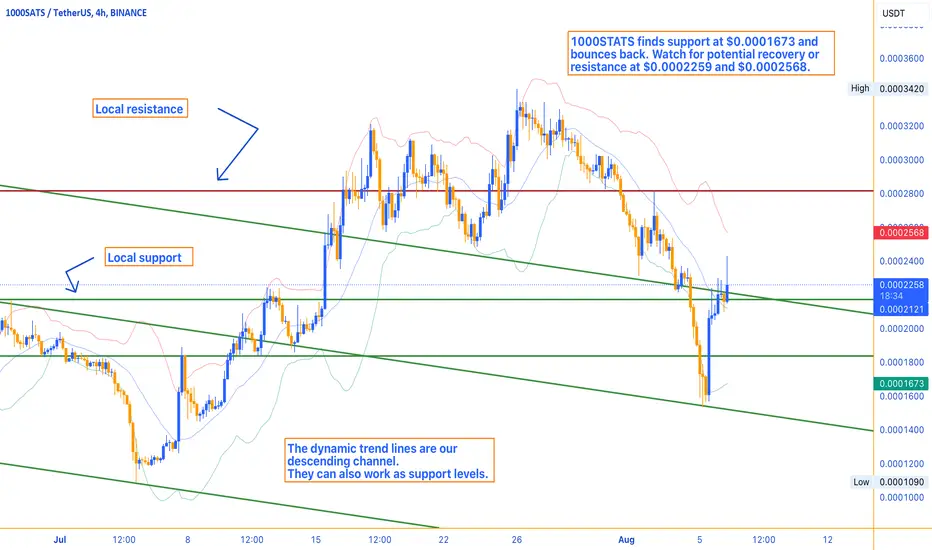
The price of 1000SATS has found local support at $0.0001673 and has rebounded to the current level of $0.000225. The dynamic trend lines forming the descending channel act as significant support and resistance levels. Breaking above the dynamic resistance could signal a potential upward movement, but the overall trend within the descending channel remains bearish until a clear breakout is observed.
1000SATS has shown some recovery from its recent lows, but the market conditions remain uncertain. Traders should watch for a breakout above the dynamic resistance levels for potential bullish confirmation. Given the broader market's volatility, it's essential to stay updated with macroeconomic news and trends.
交易开始
The price has reacted positively to the support levels.
Join the free Telegram channel
💎 Telegram Channel: t.me/MonoCoin_Public
🔔 Bot: t.me/MonoCoinSignal_Bot?start=starter_tv
🌐 Website: MonoCoin.net
⭐️ 5-Star TrustPilot: trustpilot.com/review/monocoin.net
💎 Telegram Channel: t.me/MonoCoin_Public
🔔 Bot: t.me/MonoCoinSignal_Bot?start=starter_tv
🌐 Website: MonoCoin.net
⭐️ 5-Star TrustPilot: trustpilot.com/review/monocoin.net
相关出版物
免责声明
这些信息和出版物并非旨在提供,也不构成TradingView提供或认可的任何形式的财务、投资、交易或其他类型的建议或推荐。请阅读使用条款了解更多信息。