
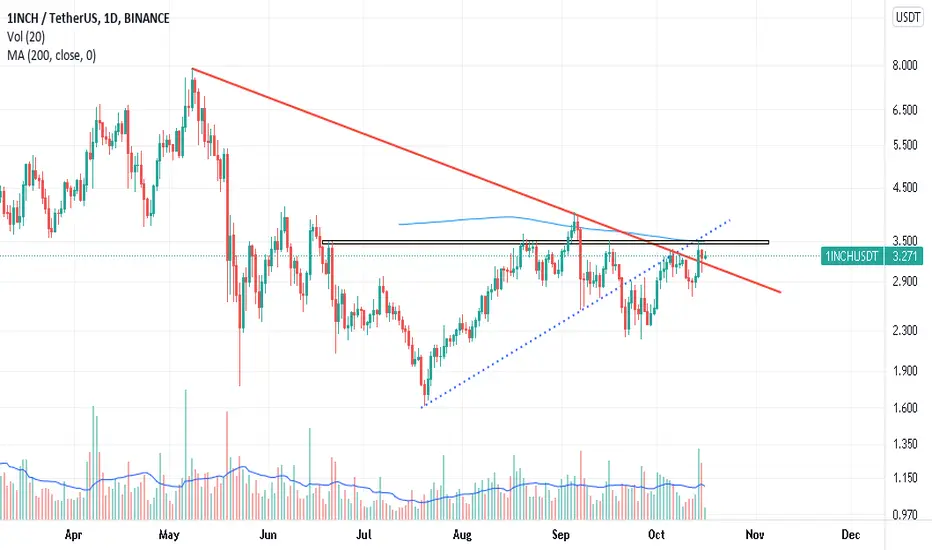
As you can see, according to the chart above, this digital currency after breaking its long-term dynamic resistance (red line), to the intersection of short-term dynamic resistance (blue dashed line that can be seen in the chart) and static resistance (orange area) and It also hit its $ 200 moving average resistance at $ 3.5 and failed to break it.
The recent short-term correction of this currency can be considered as a kind of pullback to the broken resistance and the absorption of momentum necessary to overcome the hard resistance of $ 3.5. A good entry point for the resistance is $ 3.5 and its high stabilization.
The recent short-term correction of this currency can be considered as a kind of pullback to the broken resistance and the absorption of momentum necessary to overcome the hard resistance of $ 3.5. A good entry point for the resistance is $ 3.5 and its high stabilization.

免责声明
这些信息和出版物并非旨在提供,也不构成TradingView提供或认可的任何形式的财务、投资、交易或其他类型的建议或推荐。请阅读使用条款了解更多信息。