
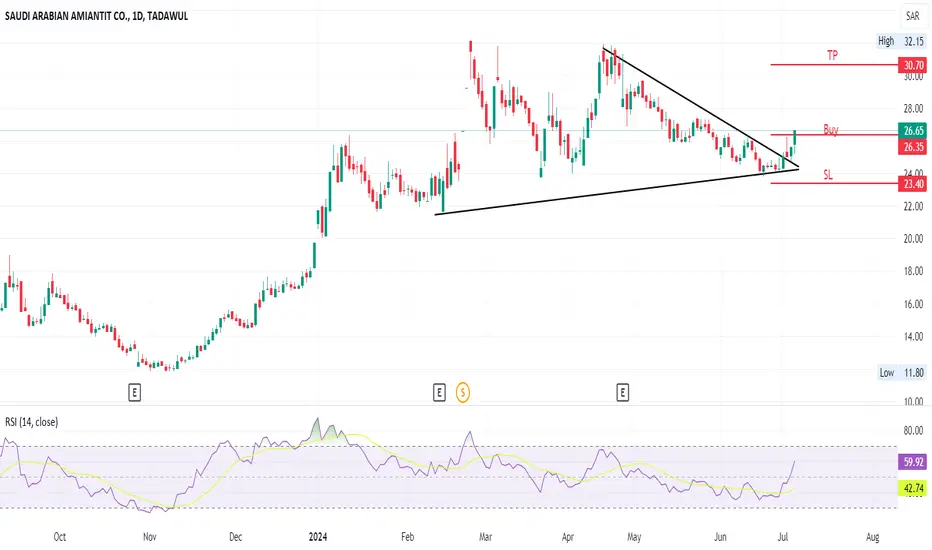
A symmetrical triangle is a chart pattern used in technical analysis that typically forms during a trend as a continuation pattern. It is characterized by two converging trendlines connecting a series of sequential peaks and troughs. The upper trendline is downward sloping, while the lower trendline is upward sloping. Here are some key points about symmetrical triangles:
Formation:
Symmetrical triangles occur when the price action of an asset is consolidating and moving into a tighter range.
It consists of two trendlines: one descending (upper) and one ascending (lower), which converge to form a triangle.
Volume:
Volume usually decreases during the formation of the pattern, indicating a period of consolidation.
Volume should then increase as the price breaks out of the triangle, confirming the breakout direction.
Breakout Direction:
The breakout can occur in either direction (up or down).
The direction of the breakout often continues the prior trend, but it can also signify a reversal.
Trading the Pattern:
Traders often look for a breakout above the upper trendline or below the lower trendline to enter a trade.
The target price after the breakout can be estimated by measuring the height of the triangle at its widest part and projecting that distance from the breakout point.
Reliability:
Symmetrical triangles are considered neutral patterns and require confirmation through breakout direction.
It's important to use other technical indicators or patterns to confirm the breakout to avoid false signals.
Formation:
Symmetrical triangles occur when the price action of an asset is consolidating and moving into a tighter range.
It consists of two trendlines: one descending (upper) and one ascending (lower), which converge to form a triangle.
Volume:
Volume usually decreases during the formation of the pattern, indicating a period of consolidation.
Volume should then increase as the price breaks out of the triangle, confirming the breakout direction.
Breakout Direction:
The breakout can occur in either direction (up or down).
The direction of the breakout often continues the prior trend, but it can also signify a reversal.
Trading the Pattern:
Traders often look for a breakout above the upper trendline or below the lower trendline to enter a trade.
The target price after the breakout can be estimated by measuring the height of the triangle at its widest part and projecting that distance from the breakout point.
Reliability:
Symmetrical triangles are considered neutral patterns and require confirmation through breakout direction.
It's important to use other technical indicators or patterns to confirm the breakout to avoid false signals.

免责声明
这些信息和出版物并非旨在提供,也不构成TradingView提供或认可的任何形式的财务、投资、交易或其他类型的建议或推荐。请阅读使用条款了解更多信息。
免责声明
这些信息和出版物并非旨在提供,也不构成TradingView提供或认可的任何形式的财务、投资、交易或其他类型的建议或推荐。请阅读使用条款了解更多信息。