
Text me if you have any questions/comments for me.
-----
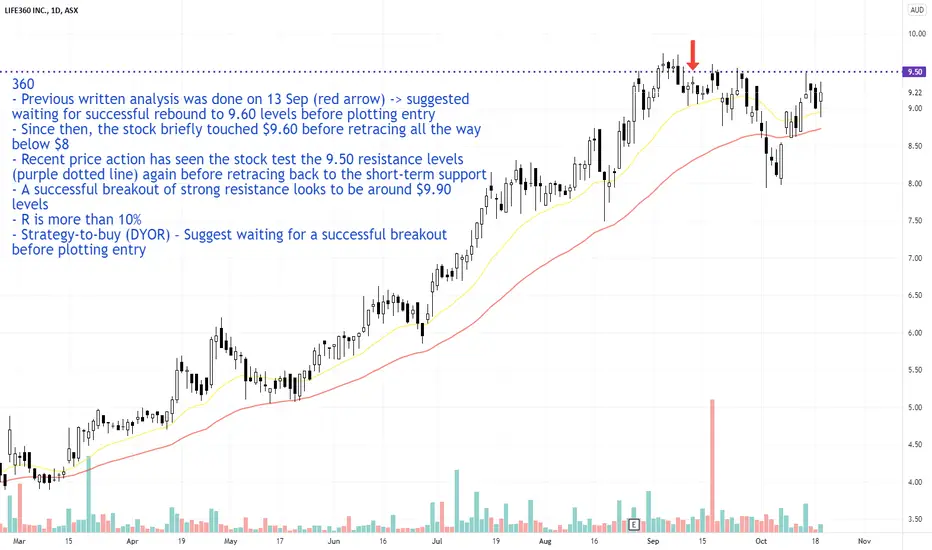
360
- Previous written analysis was done on 13 Sep (red arrow) -> suggested waiting for successful rebound to 9.60 levels before plotting entry
- Since then, the stock briefly touched $9.60 before retracing all the way below $8
- Recent price action has seen the stock test the 9.50 resistance levels (purple dotted line) again before retracing back to the short-term support
- A successful breakout of strong resistance looks to be around $9.90 levels
- R is more than 10%
- Strategy-to-buy (DYOR) – Suggest waiting for a successful breakout before plotting entry

免责声明
这些信息和出版物并非旨在提供,也不构成TradingView提供或认可的任何形式的财务、投资、交易或其他类型的建议或推荐。请阅读使用条款了解更多信息。