
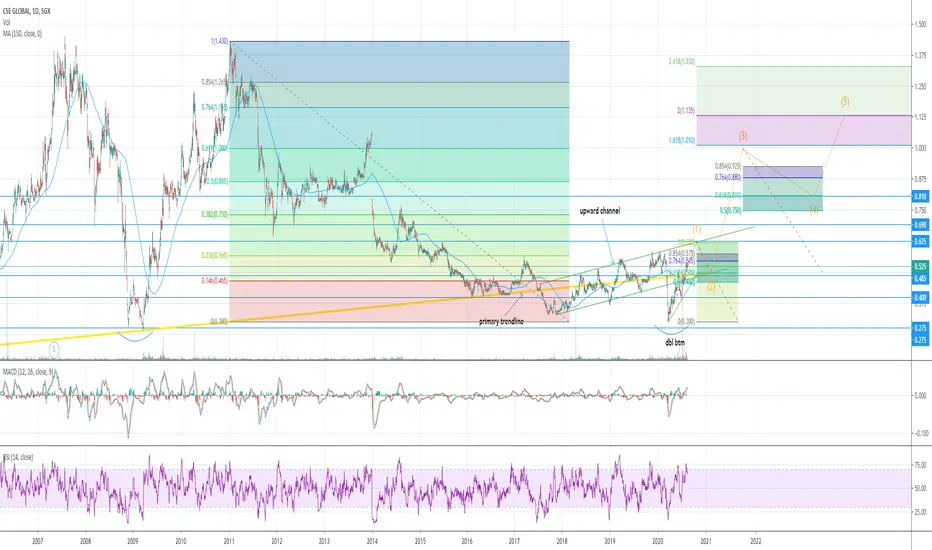
1. Trend Analysis
Downtrend
2. Indicator analysis
Weekly 150SMA
Increasing volume
overrated MACD ( Bearish)
Overbought RSI w low vol (bearish)
3. Trendline Analysis
Due to closure below primary trendline(yellow)
,buyers are afraid of entering as a major
drop may happen.
4..S&R Analysis
Support comes at Primary trendline (in yellow)
Resistance at upper channel line( in green)
5. Breakout Analysis
Elliot wave Charting with key fib in place and
predicted movement in orange
6. Pattern analysis
Recovery or reversal from double btm
Trading Plan (Impulsive Elliot wave)
Entry @ around 0.5 when it comes back from 0.625
Stop loss: weekly close below 0.4
TP(1):0.99 ~ 1
TP(2): 1.125
Pls DYODD
Downtrend
2. Indicator analysis
Weekly 150SMA
Increasing volume
overrated MACD ( Bearish)
Overbought RSI w low vol (bearish)
3. Trendline Analysis
Due to closure below primary trendline(yellow)
,buyers are afraid of entering as a major
drop may happen.
4..S&R Analysis
Support comes at Primary trendline (in yellow)
Resistance at upper channel line( in green)
5. Breakout Analysis
Elliot wave Charting with key fib in place and
predicted movement in orange
6. Pattern analysis
Recovery or reversal from double btm
Trading Plan (Impulsive Elliot wave)
Entry @ around 0.5 when it comes back from 0.625
Stop loss: weekly close below 0.4
TP(1):0.99 ~ 1
TP(2): 1.125
Pls DYODD

免责声明
这些信息和出版物并非旨在提供,也不构成TradingView提供或认可的任何形式的财务、投资、交易或其他类型的建议或推荐。请阅读使用条款了解更多信息。
免责声明
这些信息和出版物并非旨在提供,也不构成TradingView提供或认可的任何形式的财务、投资、交易或其他类型的建议或推荐。请阅读使用条款了解更多信息。