
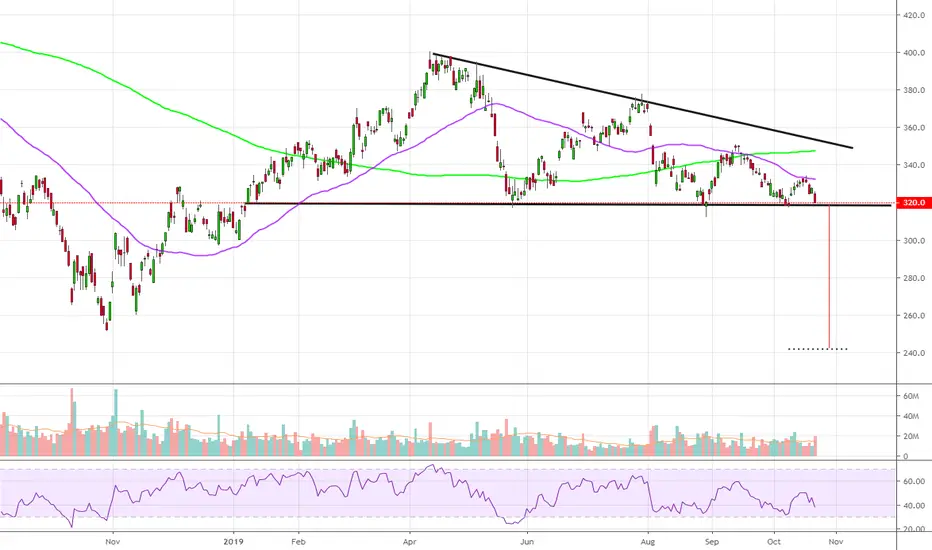
Tencent in Hong Kong looks to be developing a flat bottom triangle pattern - otherwise known as a descending triangle. My only concern from a technical perspective is that these patterns are normally continuation patterns which develop in the direction of the preceding trend. However, there are instances when descending triangles form as reversal patterns at the end of an uptrend. Watch for a convincing daily close below the horizontal support line between (318-320). More importantly, a high volume break would provide better confirmation that this is indeed a true breakdown and will also provide a better probability that this pattern plays out. Should this technical pattern work out on a confirmed break below 318, it has a technical target of 243 HK$ which is roughly 24% away from current levels. The repercussions of this playing out has far-reaching consequences for our market given the elevated weightings which Naspers and Prosus occupy on our local indices.
What is also interesting to take note of is that the last time we saw the death cross (50dma < 200dma) in Jun/Jul 18' on Tencent, we witnessed the stock have an aggressive sell off from R400 down to R250. This death cross has once again taken place in September..
What is also interesting to take note of is that the last time we saw the death cross (50dma < 200dma) in Jun/Jul 18' on Tencent, we witnessed the stock have an aggressive sell off from R400 down to R250. This death cross has once again taken place in September..

"If you do what you love, you'll never work a day in your life" - Marc Anthony
免责声明
这些信息和出版物并非旨在提供,也不构成TradingView提供或认可的任何形式的财务、投资、交易或其他类型的建议或推荐。请阅读使用条款了解更多信息。
"If you do what you love, you'll never work a day in your life" - Marc Anthony
免责声明
这些信息和出版物并非旨在提供,也不构成TradingView提供或认可的任何形式的财务、投资、交易或其他类型的建议或推荐。请阅读使用条款了解更多信息。