
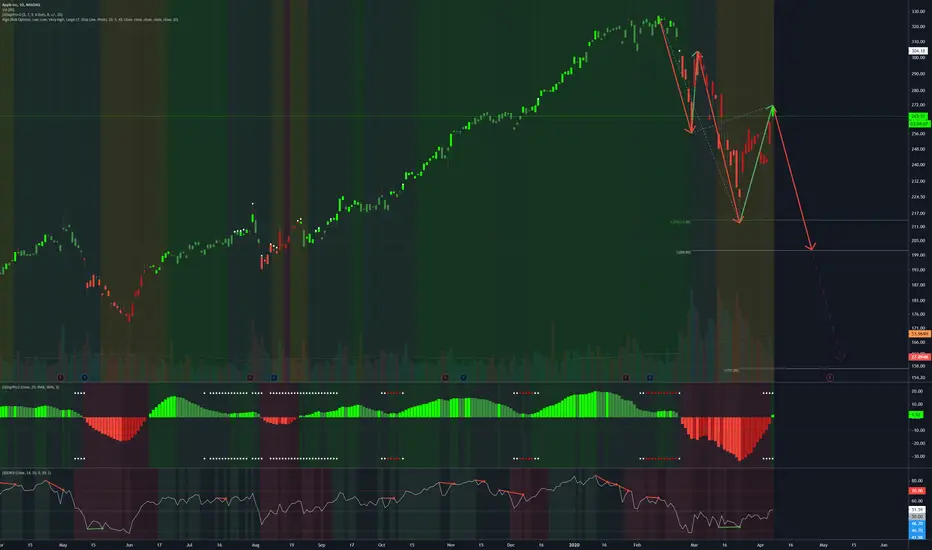
I am going to start sharing a lot more of my chart analysis with the community. This is a potential scenario in the event the market turns for lower lows. A leading diagonal in EW with wave 5 showing equality with wave 1 at 200. Also included the "extended 5th wave" scenario since wave 3 was only 1.272 of wave 1. I don't think that is likely though, but if the market turns back down I'd be watching for that 200 level on AAPL for sure.

免责声明
这些信息和出版物并非旨在提供,也不构成TradingView提供或认可的任何形式的财务、投资、交易或其他类型的建议或推荐。请阅读使用条款了解更多信息。