
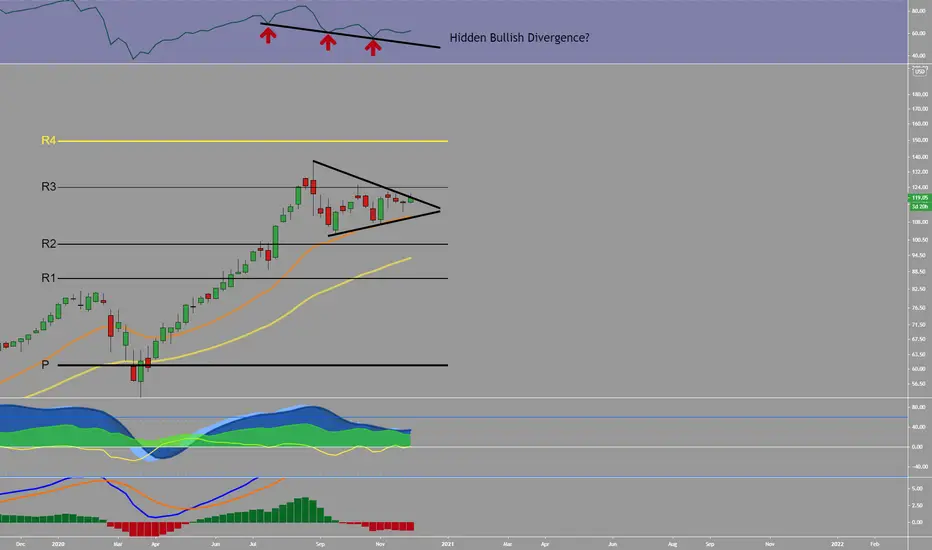
Lately, tech stocks have seen lots of sideways price action over the last few weeks. The Apple chart looks to have formed a symmetrical triangle on top of the weekly 21EMA with hidden bullish divergence on the RSI. A daily close above the $121 resistance level could trigger a move towards the $125 weekly resistance. A weekly close above $125 may push prices back to the $137 high or the R4 yearly pivot.
注释
Looks like the hidden bullish divergence is playing out, congrats to all who were on the train.
免责声明
这些信息和出版物并非旨在提供,也不构成TradingView提供或认可的任何形式的财务、投资、交易或其他类型的建议或推荐。请阅读使用条款了解更多信息。
免责声明
这些信息和出版物并非旨在提供,也不构成TradingView提供或认可的任何形式的财务、投资、交易或其他类型的建议或推荐。请阅读使用条款了解更多信息。