
Quick TA on APPLE
For those who've heard all the news on the techstocks and antitrust FUD, here's the TA.
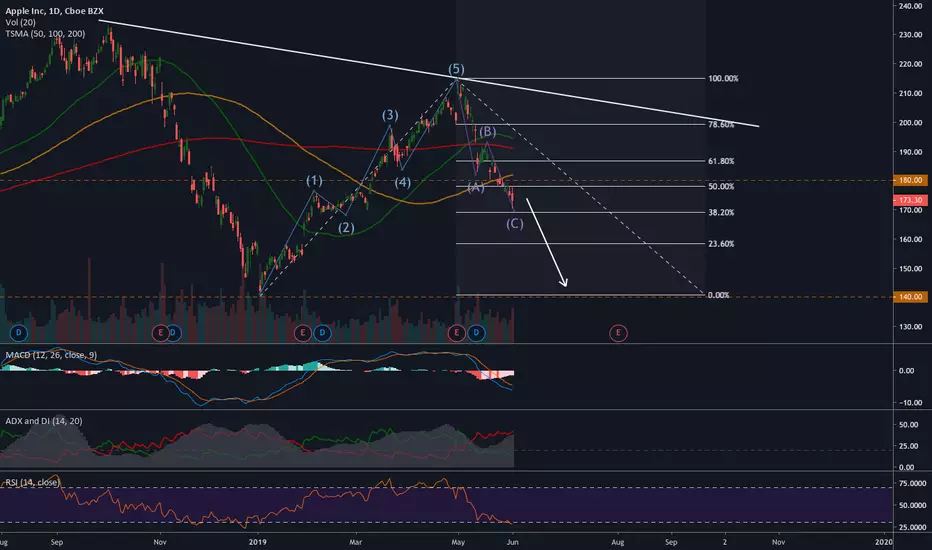
The bigger picture indicates lower highs, maxing out at $215 in April, with MACD, ADX, and RSI printing a strong downward trend since. With prices trending below the Moving Averages, it is clear that the downward price action is in full swing. As per my last TA, price action has failed all three Moving Averages showing little sign of slowing down.
Nonetheless, these are lagging indicators, and for those still bullish on the fundamentals, you might be on a lookout for a reversal. Some key levels that you should be watching are the 23% fib retracement and the possible 'double bottom' at $140 level.
Again, remember that the trend is your friend, unless you're a pro at sniping counter-trend opportunities.
For those who've heard all the news on the techstocks and antitrust FUD, here's the TA.
The bigger picture indicates lower highs, maxing out at $215 in April, with MACD, ADX, and RSI printing a strong downward trend since. With prices trending below the Moving Averages, it is clear that the downward price action is in full swing. As per my last TA, price action has failed all three Moving Averages showing little sign of slowing down.
Nonetheless, these are lagging indicators, and for those still bullish on the fundamentals, you might be on a lookout for a reversal. Some key levels that you should be watching are the 23% fib retracement and the possible 'double bottom' at $140 level.
Again, remember that the trend is your friend, unless you're a pro at sniping counter-trend opportunities.

免责声明
这些信息和出版物并非旨在提供,也不构成TradingView提供或认可的任何形式的财务、投资、交易或其他类型的建议或推荐。请阅读使用条款了解更多信息。