
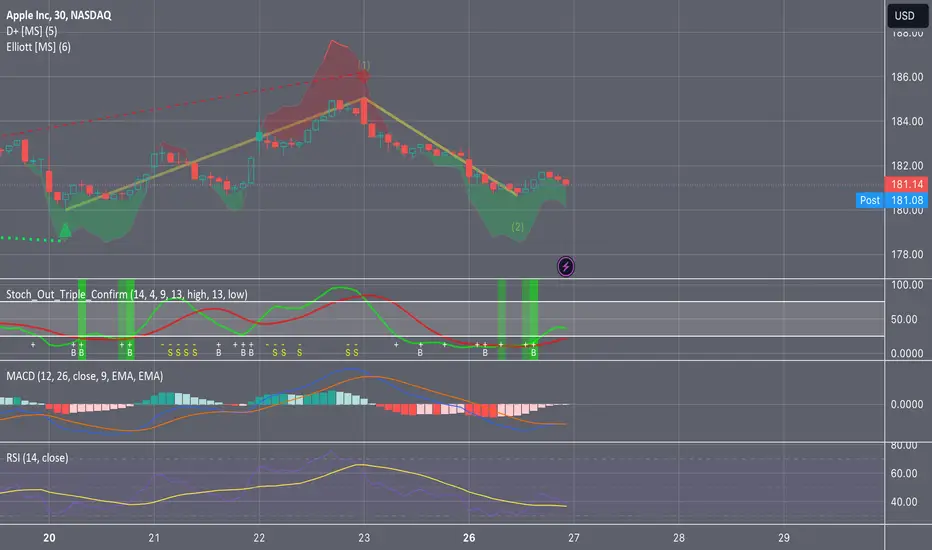
I am a previously successful trader who has been out of the game for a few years but I am getting back in to pay off some short term debt and I need to generate some extra income to pay off this high amount of short term debt. I am choosing options again because that is where I was successful before. I turned $2k into $20k 5 years ago and I believe I still got it! But enough about me, lets dissect each indicator I am using for this long call trade.
D Plus: Showing a green cloud beneath the most recent candles indicating bullish divergence. If you look further back at the last green arrow indicator it did indeed rise and we could be set up for another rise and the next buy signal could be moments away. These signals are so accurate that the creator charges a subscription for. Next!
Triple confirm: Shows several buy signals along with low RSI and lower trade volume. Trade volume could increase tomorrow with AAPL being under bought and speaking of RSI lets take a look at the true RSI indicator.
RSI: The RSI is 36.81 making AAPL extremely underbought. This could help us understand that the price will rise as more buyers will buy in bringing this level back up. Technically right now the price of Apple is a steal according to the RSI and buyers want their deals.
Divergence: Finally divergence, the divergence shows weakening bearish divergence and growing Bullish divergence. This is a sign that the bulls are regaining strength and could take over causing price to rise as buyers are buying Apple up at this price.
What are your thoughts? Would love to see them in the comments!
Good luck and happy trading!
注释
Sold at 181.63 for a 5% profit. I am 1/1 with my trades. See you all in the next one!
免责声明
这些信息和出版物并非旨在提供,也不构成TradingView提供或认可的任何形式的财务、投资、交易或其他类型的建议或推荐。请阅读使用条款了解更多信息。
免责声明
这些信息和出版物并非旨在提供,也不构成TradingView提供或认可的任何形式的财务、投资、交易或其他类型的建议或推荐。请阅读使用条款了解更多信息。