
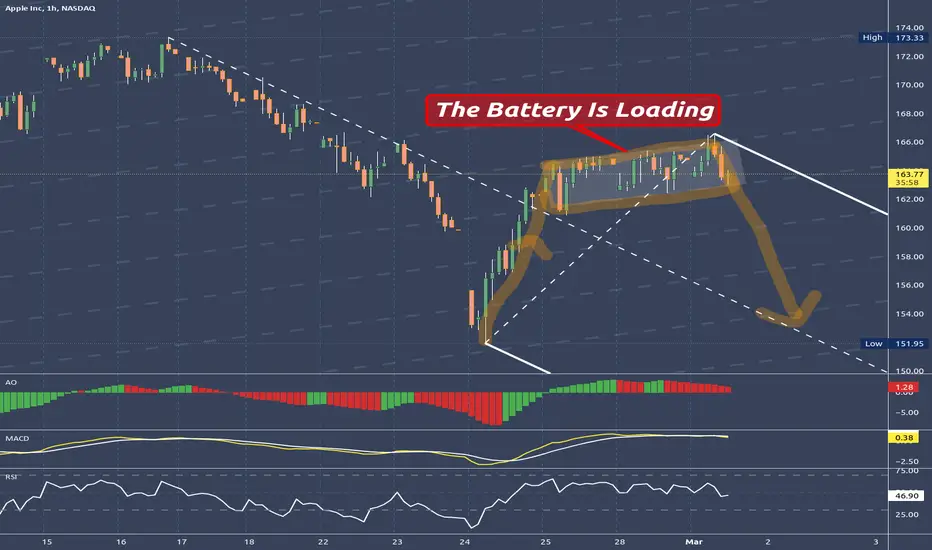
...and the unloading is near.
The dashed line just shows the frequency of Apple.
The white pitchfork shows the most probable path of price. The right leg down (orange) is about the same as the leg up.
If the down leg plays out, we will see price at least on the centerline of the white pitchfork.
I think this sideways trading has it's reason.
We will see soon.
BTW: I'm loaded too... §8-)
The dashed line just shows the frequency of Apple.
The white pitchfork shows the most probable path of price. The right leg down (orange) is about the same as the leg up.
If the down leg plays out, we will see price at least on the centerline of the white pitchfork.
I think this sideways trading has it's reason.
We will see soon.
BTW: I'm loaded too... §8-)
注释
Shifting the pitchfork to the new C point.This is, because the Battery is loading even more.
注释
注释
Centerline OK4You? §8-)注释
Until there is a open and close above the U-MLH, the target is the CL.
Remove subjective trading:
👉 Andrews Pitchforks applied by fixed rules
👉 Weekly structure maps for Indices, Futures, Energy and Crypto, plus the method behind them.
→ alphametrics.substack.com/?utm_source=tradingview
👉 Andrews Pitchforks applied by fixed rules
👉 Weekly structure maps for Indices, Futures, Energy and Crypto, plus the method behind them.
→ alphametrics.substack.com/?utm_source=tradingview
免责声明
这些信息和出版物并非旨在提供,也不构成TradingView提供或认可的任何形式的财务、投资、交易或其他类型的建议或推荐。请阅读使用条款了解更多信息。
Remove subjective trading:
👉 Andrews Pitchforks applied by fixed rules
👉 Weekly structure maps for Indices, Futures, Energy and Crypto, plus the method behind them.
→ alphametrics.substack.com/?utm_source=tradingview
👉 Andrews Pitchforks applied by fixed rules
👉 Weekly structure maps for Indices, Futures, Energy and Crypto, plus the method behind them.
→ alphametrics.substack.com/?utm_source=tradingview
免责声明
这些信息和出版物并非旨在提供,也不构成TradingView提供或认可的任何形式的财务、投资、交易或其他类型的建议或推荐。请阅读使用条款了解更多信息。