做多
Angold Resources (AAU): Potential for big upside
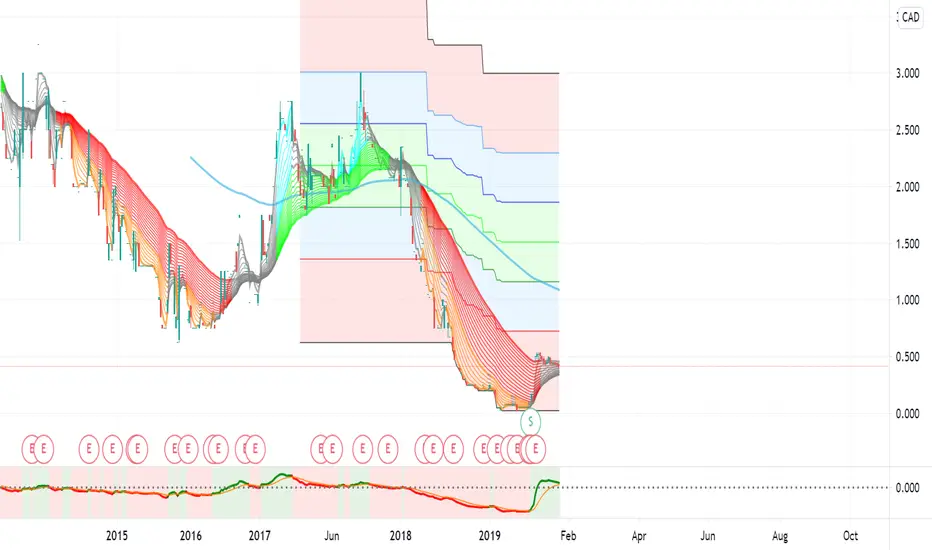
On the 1 day chart for Angold Resources you can see that my super guppy indicator has turned from Red/Orange to grey which indicates incoming volatility and a bounce in price. You can see that the fast EMA's are starting to converge and crossover with the slow EMA's which indicates a bullish reversal may be occurring. When looking at the 1 week chart we can also see a strong signal from our GMMA oscillator. In addition to this we are also starting to see the same convergence and crossover of our fast EMA's and slow EMA's on our 1 week chart that has formed on our 1 day chart. All this indicates a bullish reversal could be underway which would bring some really nice upside.

免责声明
这些信息和出版物并非旨在提供,也不构成TradingView提供或认可的任何形式的财务、投资、交易或其他类型的建议或推荐。请阅读使用条款了解更多信息。
免责声明
这些信息和出版物并非旨在提供,也不构成TradingView提供或认可的任何形式的财务、投资、交易或其他类型的建议或推荐。请阅读使用条款了解更多信息。