
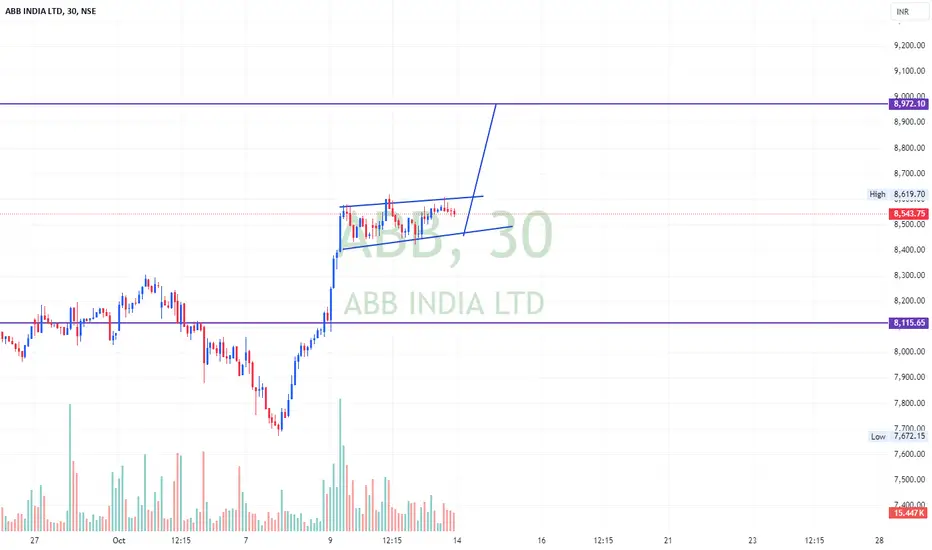
The chart shows a strong upward trend in ABB India Ltd, with a recent consolidation forming a rising wedge pattern. This pattern typically indicates a potential breakout. The price is currently testing the upper boundary of the wedge, suggesting a possible bullish breakout if it surpasses the resistance level around 8,619.70 INR.
Key Levels:
Resistance: 8,972.10 INR
Support: 8,115.65 INR
Potential Trade Idea:
Bullish Scenario: A breakout above 8,619.70 INR could lead to a rally towards the next resistance at 8,972.10 INR.
Bearish Scenario: If the price fails to break out and falls below the wedge, watch for support at 8,115.65 INR.
Key Levels:
Resistance: 8,972.10 INR
Support: 8,115.65 INR
Potential Trade Idea:
Bullish Scenario: A breakout above 8,619.70 INR could lead to a rally towards the next resistance at 8,972.10 INR.
Bearish Scenario: If the price fails to break out and falls below the wedge, watch for support at 8,115.65 INR.

免责声明
这些信息和出版物并非旨在提供,也不构成TradingView提供或认可的任何形式的财务、投资、交易或其他类型的建议或推荐。请阅读使用条款了解更多信息。
免责声明
这些信息和出版物并非旨在提供,也不构成TradingView提供或认可的任何形式的财务、投资、交易或其他类型的建议或推荐。请阅读使用条款了解更多信息。