
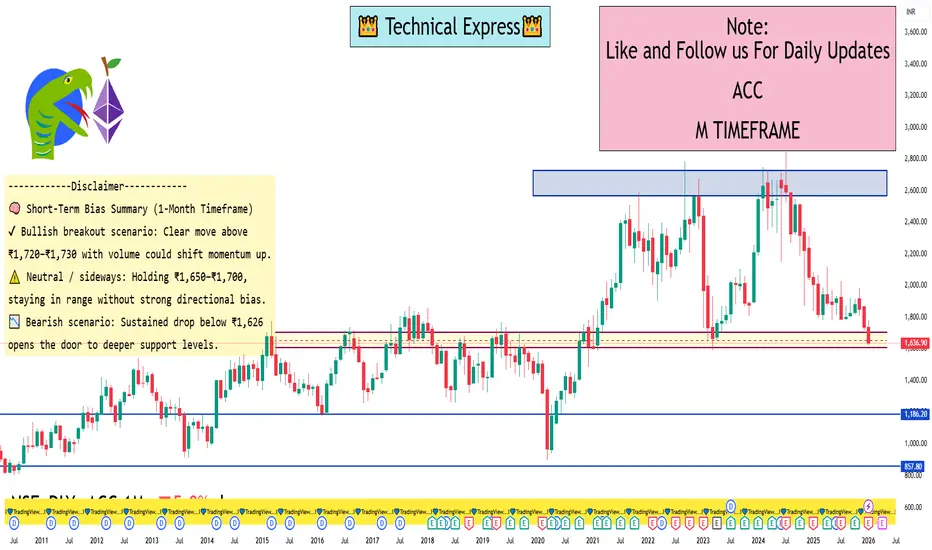
📈 1-Month Key Price Range
🔹 1-Month High: ~₹1,779 (late Jan 2026)
🔹 1-Month Low: ~₹1,626 (recent session low)
➡️ So the current 1-month trading range is roughly:
👉 ₹1,626 – ₹1,779
🔥 Short-Term Support & Resistance Levels
Support (Downside)
• S1: ~₹1,626 — recent intra-day low and current 52-week low area.
• S2: ~₹1,600 — psychological/support near multi-session lows (below recent range).
• S3: ~₹1,570 … deeper support if the range breaks down.
Resistance (Upside)
• R1: ~₹1,670–₹1,680 — immediate resistance around recent price reaction zone.
• R2: ~₹1,720 — short-term resistance near 20–30 day moving averages.
• R3: ~₹1,760–₹1,780 — recent 1-month highs.
📊 1-Month Technical Context
📉 Over the past 30 days, ACC has been in a modest downtrend/weak range, with 1-month returns in negative territory and prices sliding from the upper ₹1,700s toward mid-₹1,600s.
Technical indicators also point toward bearish/neutral momentum in the short term (e.g., RSI weak, MACD bearish) — aligning with the recent price pressures.
🔹 1-Month High: ~₹1,779 (late Jan 2026)
🔹 1-Month Low: ~₹1,626 (recent session low)
➡️ So the current 1-month trading range is roughly:
👉 ₹1,626 – ₹1,779
🔥 Short-Term Support & Resistance Levels
Support (Downside)
• S1: ~₹1,626 — recent intra-day low and current 52-week low area.
• S2: ~₹1,600 — psychological/support near multi-session lows (below recent range).
• S3: ~₹1,570 … deeper support if the range breaks down.
Resistance (Upside)
• R1: ~₹1,670–₹1,680 — immediate resistance around recent price reaction zone.
• R2: ~₹1,720 — short-term resistance near 20–30 day moving averages.
• R3: ~₹1,760–₹1,780 — recent 1-month highs.
📊 1-Month Technical Context
📉 Over the past 30 days, ACC has been in a modest downtrend/weak range, with 1-month returns in negative territory and prices sliding from the upper ₹1,700s toward mid-₹1,600s.
Technical indicators also point toward bearish/neutral momentum in the short term (e.g., RSI weak, MACD bearish) — aligning with the recent price pressures.

相关出版物
免责声明
这些信息和出版物并非旨在提供,也不构成TradingView提供或认可的任何形式的财务、投资、交易或其他类型的建议或推荐。请阅读使用条款了解更多信息。