
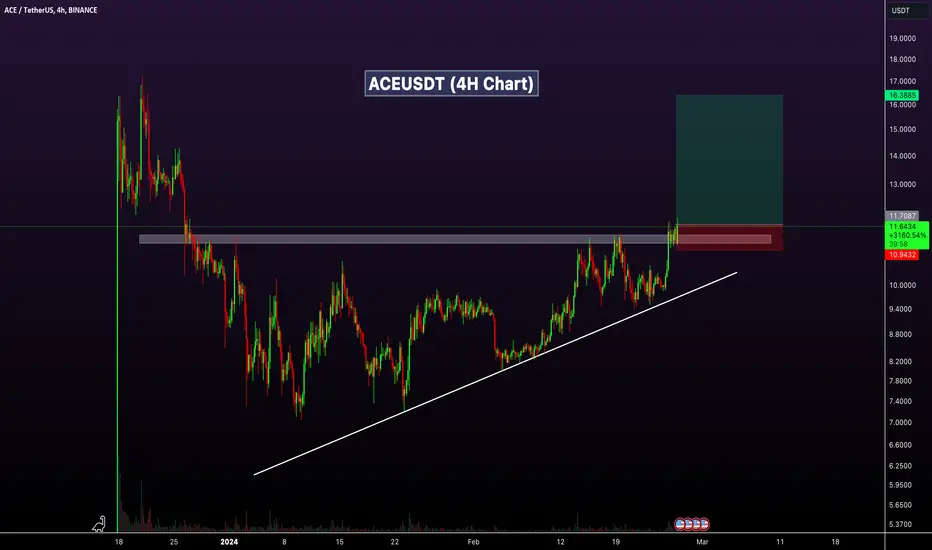
ACEUSDt Technical analysis update
ACE formed an ascending triangle pattern on the 4-hour chart. The price recently exceeded the resistance zone of the triangle, which could indicate a potential bullish move.
Buy zone : Below $11.70
Stop loss : $11.00
ACE formed an ascending triangle pattern on the 4-hour chart. The price recently exceeded the resistance zone of the triangle, which could indicate a potential bullish move.
Buy zone : Below $11.70
Stop loss : $11.00
交易手动结束
Close ACEUSDT trade manually at breakeven.
🚀Telegram : t.me/hexatrades
🌐Website: hexatrades.io/
🗣️Twitter(X): twitter.com/HexaTrades
🌐Website: hexatrades.io/
🗣️Twitter(X): twitter.com/HexaTrades
相关出版物
免责声明
这些信息和出版物并非旨在提供,也不构成TradingView提供或认可的任何形式的财务、投资、交易或其他类型的建议或推荐。请阅读使用条款了解更多信息。
🚀Telegram : t.me/hexatrades
🌐Website: hexatrades.io/
🗣️Twitter(X): twitter.com/HexaTrades
🌐Website: hexatrades.io/
🗣️Twitter(X): twitter.com/HexaTrades
相关出版物
免责声明
这些信息和出版物并非旨在提供,也不构成TradingView提供或认可的任何形式的财务、投资、交易或其他类型的建议或推荐。请阅读使用条款了解更多信息。