
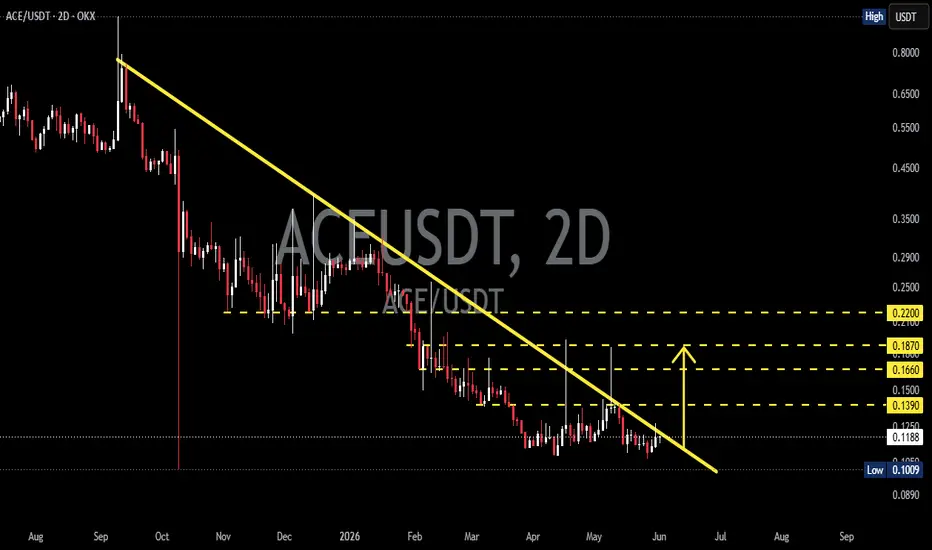
On the 2-day timeframe chart, ACE/USDT is still trading below the major Descending TrendLine that has been suppressing price action since the September 2025 peak. 📉
This structure indicates that the medium- to long-term trend remains bearish. However, the price is now approaching the final section of the trendline, which often becomes a decisive area for determining the next major move. 🎯
After experiencing a prolonged decline, the price has started forming an accumulation phase around the 0.1009 – 0.1200 USDT area. 🏗️
Selling pressure appears to be weakening while volatility is narrowing, which is often an early sign that a significant move could be approaching. ⚡
---
📐 Pattern Formation
🔻 Descending TrendLine
The primary pattern on this chart is a Descending TrendLine, connecting a series of lower highs since September 2025.
🔍 Pattern Characteristics:
✅ Indicates seller dominance for several months.
✅ Consistently forms a lower-high structure.
✅ The closer the price gets to the end of the trendline, the greater the probability of a breakout. 💥
✅ A valid breakout is typically confirmed by a candle close above the trendline accompanied by increased volume. 📊
✅ This pattern often serves as an early signal of a trend reversal when resistance is successfully broken. 🚀
---
🟢 Bullish Scenario
A bullish confirmation would occur if the price successfully breaks and holds above the Descending TrendLine. 📈
🎯 Bullish Targets:
🥇 0.1390 USDT
- The nearest resistance level after a breakout.
🥈 0.1660 USDT
- The next supply zone and intermediate resistance.
🥉 0.1870 USDT
- A higher target if buying momentum continues to strengthen.
🏆 0.2200 USDT
- The major resistance level and the ultimate bullish target shown on the chart.
🚀 Bullish Supporting Factors:
✔️ Breakout above the Descending TrendLine.
✔️ Formation of a higher low following the accumulation phase.
✔️ Increased volume during the breakout. 📊
✔️ Buyers begin taking control of the market. 🐂
✔️ Overall cryptocurrency market sentiment turns positive. 🌎
---
🔴 Bearish Scenario
As long as the price remains below the trendline, downside risks still exist. ⚠️
🎯 Bearish Targets:
🔻 0.1100 USDT
- The nearest support zone that must be defended.
🔻 0.1009 USDT
- The major historical support and current cycle low.
🔻 If this support fails to hold, the price could create a new low and continue the downtrend that has been in place since 2025. 📉
⚠️ Bearish Factors:
❌ Strong rejection at the Descending TrendLine.
❌ False breakout (Fake Breakout). 🚨
❌ Weak buying volume.
❌ Sellers regain market control. 🐻
❌ The broader crypto market enters another correction phase.
---
🔍 Conclusion
ACE/USDT is currently at a highly interesting stage as the price approaches the end of its long-term Descending TrendLine. 📐
This area often becomes a critical decision point between trend continuation and a potential trend reversal. 🔄
🟢 If the price successfully breaks above and holds the trendline, the path toward 0.1390 – 0.2200 USDT becomes increasingly achievable.
🔴 However, if the breakout fails, 0.1009 USDT will once again become the key support level that buyers must defend.
📌 Traders should wait for a valid breakout confirmation before making major decisions, as the current area represents a high-volatility zone. ⚡
💡 In other words, ACE/USDT is currently in a "make-or-break" phase that could determine the direction of the next major trend over the coming weeks.
#ACEUSDT #ACE #Crypto 🚀 #Cryptocurrency #Altcoin #TradingView #TechnicalAnalysis 📊 #ChartAnalysis #PriceAction #DescendingTrendline #Breakout 💥 #BullishSetup 🐂 #BearishScenario 🐻 #SupportAndResistance #TrendlineBreakout #CryptoTrading #SwingTrading #AltcoinSeason #MarketStructure #CryptoMarket #TechnicalTrader #AccumulationZone #TrendReversal 🔥 #MarketAnalysis #TraderLife #BullishBreakout #CryptoCommunity
This structure indicates that the medium- to long-term trend remains bearish. However, the price is now approaching the final section of the trendline, which often becomes a decisive area for determining the next major move. 🎯
After experiencing a prolonged decline, the price has started forming an accumulation phase around the 0.1009 – 0.1200 USDT area. 🏗️
Selling pressure appears to be weakening while volatility is narrowing, which is often an early sign that a significant move could be approaching. ⚡
---
📐 Pattern Formation
🔻 Descending TrendLine
The primary pattern on this chart is a Descending TrendLine, connecting a series of lower highs since September 2025.
🔍 Pattern Characteristics:
✅ Indicates seller dominance for several months.
✅ Consistently forms a lower-high structure.
✅ The closer the price gets to the end of the trendline, the greater the probability of a breakout. 💥
✅ A valid breakout is typically confirmed by a candle close above the trendline accompanied by increased volume. 📊
✅ This pattern often serves as an early signal of a trend reversal when resistance is successfully broken. 🚀
---
🟢 Bullish Scenario
A bullish confirmation would occur if the price successfully breaks and holds above the Descending TrendLine. 📈
🎯 Bullish Targets:
🥇 0.1390 USDT
- The nearest resistance level after a breakout.
🥈 0.1660 USDT
- The next supply zone and intermediate resistance.
🥉 0.1870 USDT
- A higher target if buying momentum continues to strengthen.
🏆 0.2200 USDT
- The major resistance level and the ultimate bullish target shown on the chart.
🚀 Bullish Supporting Factors:
✔️ Breakout above the Descending TrendLine.
✔️ Formation of a higher low following the accumulation phase.
✔️ Increased volume during the breakout. 📊
✔️ Buyers begin taking control of the market. 🐂
✔️ Overall cryptocurrency market sentiment turns positive. 🌎
---
🔴 Bearish Scenario
As long as the price remains below the trendline, downside risks still exist. ⚠️
🎯 Bearish Targets:
🔻 0.1100 USDT
- The nearest support zone that must be defended.
🔻 0.1009 USDT
- The major historical support and current cycle low.
🔻 If this support fails to hold, the price could create a new low and continue the downtrend that has been in place since 2025. 📉
⚠️ Bearish Factors:
❌ Strong rejection at the Descending TrendLine.
❌ False breakout (Fake Breakout). 🚨
❌ Weak buying volume.
❌ Sellers regain market control. 🐻
❌ The broader crypto market enters another correction phase.
---
🔍 Conclusion
ACE/USDT is currently at a highly interesting stage as the price approaches the end of its long-term Descending TrendLine. 📐
This area often becomes a critical decision point between trend continuation and a potential trend reversal. 🔄
🟢 If the price successfully breaks above and holds the trendline, the path toward 0.1390 – 0.2200 USDT becomes increasingly achievable.
🔴 However, if the breakout fails, 0.1009 USDT will once again become the key support level that buyers must defend.
📌 Traders should wait for a valid breakout confirmation before making major decisions, as the current area represents a high-volatility zone. ⚡
💡 In other words, ACE/USDT is currently in a "make-or-break" phase that could determine the direction of the next major trend over the coming weeks.
#ACEUSDT #ACE #Crypto 🚀 #Cryptocurrency #Altcoin #TradingView #TechnicalAnalysis 📊 #ChartAnalysis #PriceAction #DescendingTrendline #Breakout 💥 #BullishSetup 🐂 #BearishScenario 🐻 #SupportAndResistance #TrendlineBreakout #CryptoTrading #SwingTrading #AltcoinSeason #MarketStructure #CryptoMarket #TechnicalTrader #AccumulationZone #TrendReversal 🔥 #MarketAnalysis #TraderLife #BullishBreakout #CryptoCommunity

✅ Get Free Signals! Join Our Telegram Channel Here: t.me/TheCryptoNuclear
✅ Twitter: twitter.com/crypto_nuclear
✅ Join Bybit : partner.bybit.com/b/nuclearvip
✅ Benefits : Lifetime Trading Fee Discount -50%
✅ Twitter: twitter.com/crypto_nuclear
✅ Join Bybit : partner.bybit.com/b/nuclearvip
✅ Benefits : Lifetime Trading Fee Discount -50%
免责声明
这些信息和出版物并非旨在提供,也不构成TradingView提供或认可的任何形式的财务、投资、交易或其他类型的建议或推荐。请阅读使用条款了解更多信息。
✅ Get Free Signals! Join Our Telegram Channel Here: t.me/TheCryptoNuclear
✅ Twitter: twitter.com/crypto_nuclear
✅ Join Bybit : partner.bybit.com/b/nuclearvip
✅ Benefits : Lifetime Trading Fee Discount -50%
✅ Twitter: twitter.com/crypto_nuclear
✅ Join Bybit : partner.bybit.com/b/nuclearvip
✅ Benefits : Lifetime Trading Fee Discount -50%
免责声明
这些信息和出版物并非旨在提供,也不构成TradingView提供或认可的任何形式的财务、投资、交易或其他类型的建议或推荐。请阅读使用条款了解更多信息。