
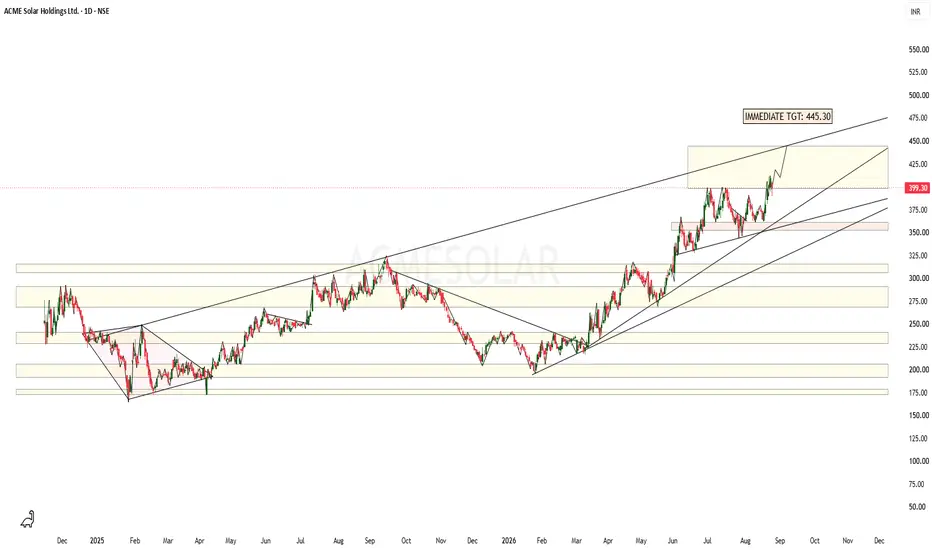
Presenting One More Chart Analysis after a Long time...
ACME SOLAR HOLDINGS LTD Chart is quite strong with Bullish View and looks promising at
CMP 399.30.
Patterns are drawn on Daily Chart and as usual complex & detailed drawing with Price Analysis is presented considering all the aspects of the chart.
Target & SL is as follows:
Tgt: 445.30
SL: 380-385 (Closing Basis)
Market is all about OPPORTUNITY / ENTRY / TIMING !!!!!
Basis some minute observations, chart analysis is made, target and SL is given to understand the core of the subject and for learning purpose only.
ACME SOLAR HOLDINGS LTD Chart is quite strong with Bullish View and looks promising at
CMP 399.30.
Patterns are drawn on Daily Chart and as usual complex & detailed drawing with Price Analysis is presented considering all the aspects of the chart.
Target & SL is as follows:
Tgt: 445.30
SL: 380-385 (Closing Basis)
Market is all about OPPORTUNITY / ENTRY / TIMING !!!!!
Basis some minute observations, chart analysis is made, target and SL is given to understand the core of the subject and for learning purpose only.

免责声明
这些信息和出版物并非旨在提供,也不构成TradingView提供或认可的任何形式的财务、投资、交易或其他类型的建议或推荐。请阅读使用条款了解更多信息。
免责声明
这些信息和出版物并非旨在提供,也不构成TradingView提供或认可的任何形式的财务、投资、交易或其他类型的建议或推荐。请阅读使用条款了解更多信息。