
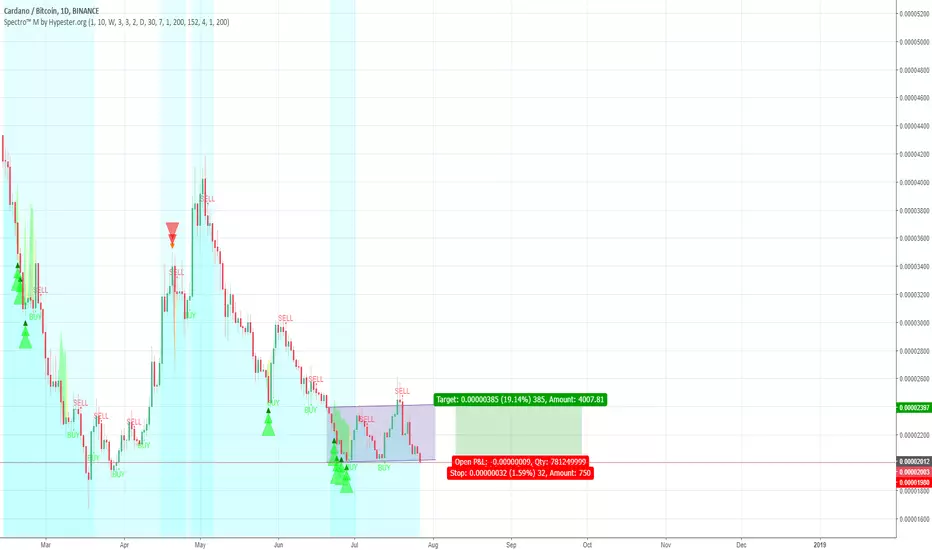
This is a signal using Spectro™ M
The blue background means a reversal zone. After the first reversal zone, you will see the Specter Clouds (green area above price) predicted the price channel 9 days before it happened.
We see many of those "GREEN TRIANGLES" which mean that Spectro™ M confirmed a consensus on more than 20 indicators. So that was a strong reversal, and it was a very good and clean 10% trade.
I've been playing around with this bouncing - it's a fat and nice 20% channel
Right now we are much closer to a strong and old support than any other strong resistance, therefore the upside is bigger than the downside.
We didn't have any Spectro™ M confirmations yet, but still, this is an asset that you might want to watch closely if you're trading with Spectro™ M.
Targets around 15%~20% from entry.
Liked it? Give it a shot at, it's really affordable - you wouldn't believe if I told you: hypester.org/spectro-indicator/
The blue background means a reversal zone. After the first reversal zone, you will see the Specter Clouds (green area above price) predicted the price channel 9 days before it happened.
We see many of those "GREEN TRIANGLES" which mean that Spectro™ M confirmed a consensus on more than 20 indicators. So that was a strong reversal, and it was a very good and clean 10% trade.
I've been playing around with this bouncing - it's a fat and nice 20% channel
Right now we are much closer to a strong and old support than any other strong resistance, therefore the upside is bigger than the downside.
We didn't have any Spectro™ M confirmations yet, but still, this is an asset that you might want to watch closely if you're trading with Spectro™ M.
Targets around 15%~20% from entry.
Liked it? Give it a shot at, it's really affordable - you wouldn't believe if I told you: hypester.org/spectro-indicator/
注释
Even though it broke the support, if you are using Spectro™ M that's even better!Wait for the buy signal, that would be the entry confirmation and the sell target would be around the same as before, therefore the max potential profit will increase.
Just watch for the only resistance at 2000 sats

免责声明
这些信息和出版物并非旨在提供,也不构成TradingView提供或认可的任何形式的财务、投资、交易或其他类型的建议或推荐。请阅读使用条款了解更多信息。
免责声明
这些信息和出版物并非旨在提供,也不构成TradingView提供或认可的任何形式的财务、投资、交易或其他类型的建议或推荐。请阅读使用条款了解更多信息。