
Apoorv Dubey | SEBI Registered Research Analyst | INH000030287
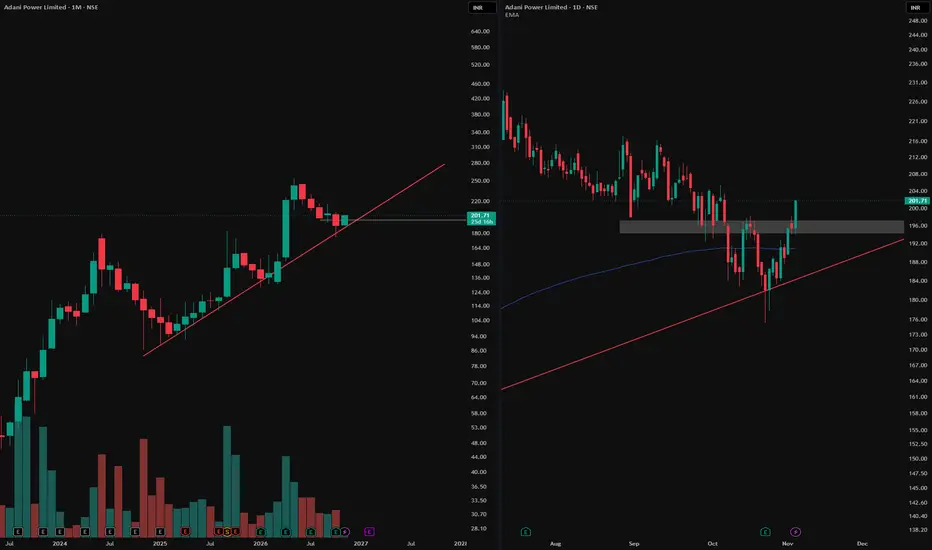
Monthly chart (left): The red line marks rising support. Price has reacted around this trendline several times, making it a useful reference for the broader trend.
Daily chart (right): Zoom in on the latest reaction and you’ll see a W-shaped bottom. The grey zone first acted as support, then became resistance after price broke below it. It also marked the area of the rebound between the two lows. The latest daily candle closed above that zone, reclaiming it.
The takeaway: The monthly chart shows where price reacted. The daily chart shows how the reversal developed. A close above the grey zone marks the breakout on this chart; whether price holds above it is a separate question.
For educational purposes only. This is not a recommendation to buy, sell or hold Adani Power or any other security.
Monthly chart (left): The red line marks rising support. Price has reacted around this trendline several times, making it a useful reference for the broader trend.
Daily chart (right): Zoom in on the latest reaction and you’ll see a W-shaped bottom. The grey zone first acted as support, then became resistance after price broke below it. It also marked the area of the rebound between the two lows. The latest daily candle closed above that zone, reclaiming it.
The takeaway: The monthly chart shows where price reacted. The daily chart shows how the reversal developed. A close above the grey zone marks the breakout on this chart; whether price holds above it is a separate question.
For educational purposes only. This is not a recommendation to buy, sell or hold Adani Power or any other security.

📊Swing & positional research with Buy, Sell & Hold recommendations
Contact for NOVEMBER SLOTS
📞WhatsApp ( Pro ): wa.me/919455664601
📢Free Picks on Telegram ( Join ) : t.me/hashtaghammer
Apoorv Dubey|SEBI RA INH000030287
Contact for NOVEMBER SLOTS
📞WhatsApp ( Pro ): wa.me/919455664601
📢Free Picks on Telegram ( Join ) : t.me/hashtaghammer
Apoorv Dubey|SEBI RA INH000030287
相关出版物
免责声明
这些信息和出版物并非旨在提供,也不构成TradingView提供或认可的任何形式的财务、投资、交易或其他类型的建议或推荐。请阅读使用条款了解更多信息。
📊Swing & positional research with Buy, Sell & Hold recommendations
Contact for NOVEMBER SLOTS
📞WhatsApp ( Pro ): wa.me/919455664601
📢Free Picks on Telegram ( Join ) : t.me/hashtaghammer
Apoorv Dubey|SEBI RA INH000030287
Contact for NOVEMBER SLOTS
📞WhatsApp ( Pro ): wa.me/919455664601
📢Free Picks on Telegram ( Join ) : t.me/hashtaghammer
Apoorv Dubey|SEBI RA INH000030287
相关出版物
免责声明
这些信息和出版物并非旨在提供,也不构成TradingView提供或认可的任何形式的财务、投资、交易或其他类型的建议或推荐。请阅读使用条款了解更多信息。