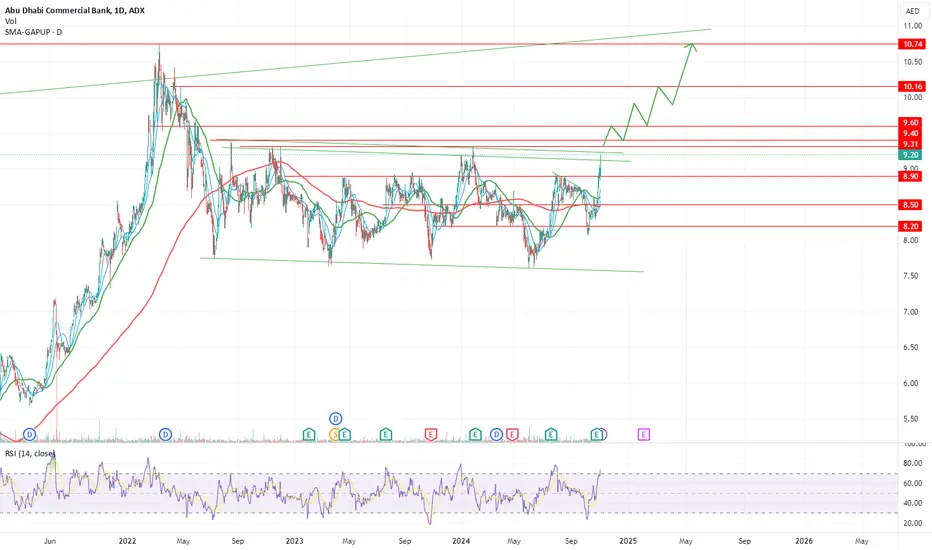
 ADCB chart is amazing! More than two years of consolidation and now the stock seems to be ready to move forward. This is a long term buy and targets are higher than the levels shown on the chart, the anticipated price movement shown on the chart should unfold in the coming 6 to 12 months if the stock breaks above the level 9.31~9.4 AED. Stoploss daily close below 8.8 AED.
 交易结束:到达目标

免责声明
这些信息和出版物并非旨在提供,也不构成TradingView提供或认可的任何形式的财务、投资、交易或其他类型的建议或推荐。请阅读使用条款了解更多信息。
免责声明
这些信息和出版物并非旨在提供,也不构成TradingView提供或认可的任何形式的财务、投资、交易或其他类型的建议或推荐。请阅读使用条款了解更多信息。