
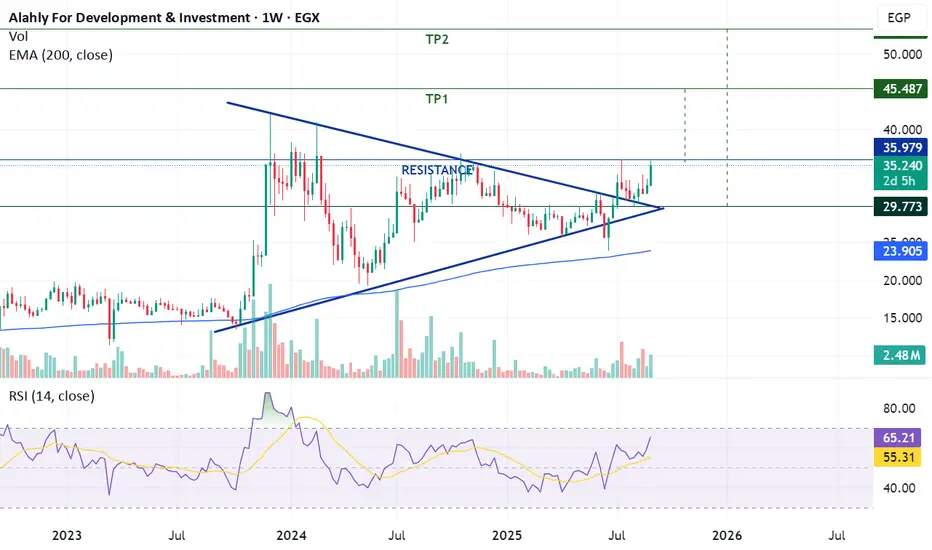
(AFDI)
The stock previously formed a symmetrical triangle, which was successfully broken on July 9. On the weekly chart, a clear Cup & Handle pattern has also developed.
If the price breaks above 35.8 and sustains, this would validate the pattern and open the way for the following medium- to long-term targets: 45 – 53.
⚠ The stop-loss level after a confirmed breakout is set at 35.5.
Trade Setup:
-Stock Code: AFDI
-Potential Buy Range: 35.8 – 36.8
-Target Price 1 (TP1): 45
-Target Price 2 (TP2): 53
-Stop-Loss (SL): 35.5 after breakout
The stock previously formed a symmetrical triangle, which was successfully broken on July 9. On the weekly chart, a clear Cup & Handle pattern has also developed.
If the price breaks above 35.8 and sustains, this would validate the pattern and open the way for the following medium- to long-term targets: 45 – 53.
⚠ The stop-loss level after a confirmed breakout is set at 35.5.
Trade Setup:
-Stock Code: AFDI
-Potential Buy Range: 35.8 – 36.8
-Target Price 1 (TP1): 45
-Target Price 2 (TP2): 53
-Stop-Loss (SL): 35.5 after breakout

免责声明
这些信息和出版物并非旨在提供,也不构成TradingView提供或认可的任何形式的财务、投资、交易或其他类型的建议或推荐。请阅读使用条款了解更多信息。
免责声明
这些信息和出版物并非旨在提供,也不构成TradingView提供或认可的任何形式的财务、投资、交易或其他类型的建议或推荐。请阅读使用条款了解更多信息。