SINGULARITYNET AGI Daily 200 MA Confirm a Descending Triangle
SINGULARITYNET AGI Daily 200 MA Confirm a Descending Triangle
Hi guys,
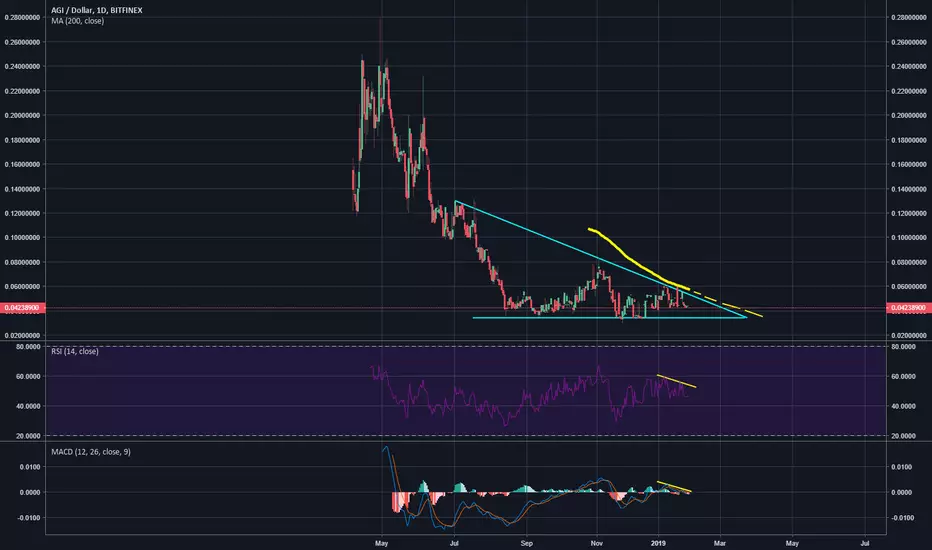
On the Logarithmic Scale, we can see how the Daily 200 MA held the price as a resistance and confirmed the formation of a descending triangle pattern.
On the other hand, we can see how the bearish divergences of the MACD and RSI show us that there is more probabilities that AGI could test the bottom of the triangle (price 0,033 USD) than break the 200 MA.
In my opinion, if AGI confirm a breaking of the bottom of the triangle with a high volume, we could test lowers bottoms. It will depend of the Bitcoin price behavior. So if Bitcoin break the 3000$ support, we probably will see AGI testing newer lowers than the previous 0,03 USD support
Hi guys,
On the Logarithmic Scale, we can see how the Daily 200 MA held the price as a resistance and confirmed the formation of a descending triangle pattern.
On the other hand, we can see how the bearish divergences of the MACD and RSI show us that there is more probabilities that AGI could test the bottom of the triangle (price 0,033 USD) than break the 200 MA.
In my opinion, if AGI confirm a breaking of the bottom of the triangle with a high volume, we could test lowers bottoms. It will depend of the Bitcoin price behavior. So if Bitcoin break the 3000$ support, we probably will see AGI testing newer lowers than the previous 0,03 USD support

免责声明
这些信息和出版物并非旨在提供,也不构成TradingView提供或认可的任何形式的财务、投资、交易或其他类型的建议或推荐。请阅读使用条款了解更多信息。