
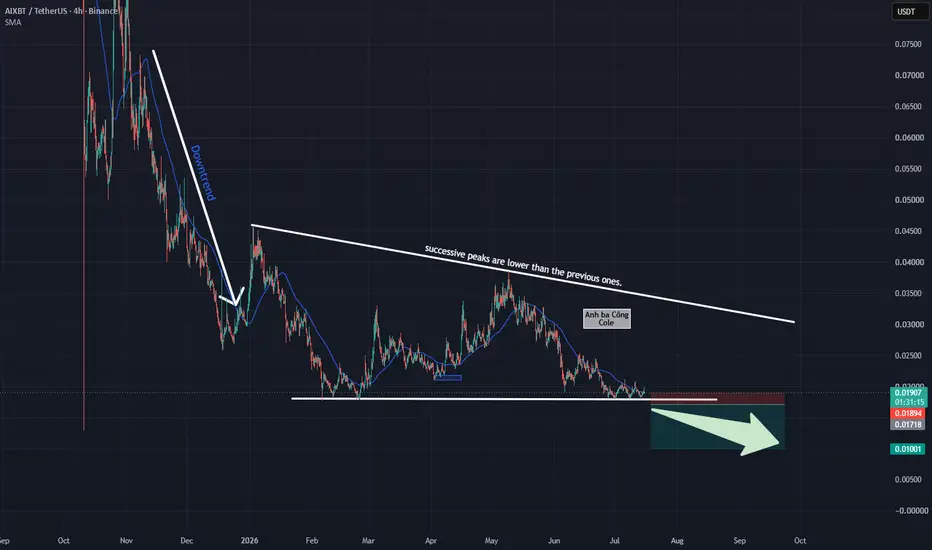
AIXBT: Bearish Compression Pattern – Optimal Opportunity to Trigger Short Upon Support Breakdown
AIXBT is flashing highly definitive technical signals indicating the continuation of its prior long-term downtrend. The market structure at this stage is fully controlled by the bears as selling pressure continues to mount. Following a steep decline late last year, the price action transitioned into a sideways consolidation triangle characterized by a sequential series of lower highs. This structural compression is a classic signal of supply accumulation, proving that buying demand is completely exhausted.
Based on the visual data from chart , the price candles are currently hugging the lower horizontal support line tightly. Simultaneously, the price is compressed directly beneath the dynamic MA100 moving average barrier. Being consistently suppressed by this dynamic line indicates that the buyers lack the strength to initiate any meaningful recovery. Every minor upward bounce is swiftly rejected, turning this consolidation zone into a coiled spring ready to expand to the downside.
Consequently, the smartest trading behavior right now is to remain patient on the sidelines and strictly avoid front-running the trade. Wait for a definitive confirmation signal when a candle closes decisively below the horizontal support floor. This breakout will trigger a secure Short setup optimized with a very tight stop-loss placement just above the breached level, targeting the psychological round number zone at $0.01.
Disclaimer: This is not financial advice, DYOR.
AIXBT is flashing highly definitive technical signals indicating the continuation of its prior long-term downtrend. The market structure at this stage is fully controlled by the bears as selling pressure continues to mount. Following a steep decline late last year, the price action transitioned into a sideways consolidation triangle characterized by a sequential series of lower highs. This structural compression is a classic signal of supply accumulation, proving that buying demand is completely exhausted.
Based on the visual data from chart , the price candles are currently hugging the lower horizontal support line tightly. Simultaneously, the price is compressed directly beneath the dynamic MA100 moving average barrier. Being consistently suppressed by this dynamic line indicates that the buyers lack the strength to initiate any meaningful recovery. Every minor upward bounce is swiftly rejected, turning this consolidation zone into a coiled spring ready to expand to the downside.
Consequently, the smartest trading behavior right now is to remain patient on the sidelines and strictly avoid front-running the trade. Wait for a definitive confirmation signal when a candle closes decisively below the horizontal support floor. This breakout will trigger a secure Short setup optimized with a very tight stop-loss placement just above the breached level, targeting the psychological round number zone at $0.01.
Disclaimer: This is not financial advice, DYOR.

免责声明
这些信息和出版物并非旨在提供,也不构成TradingView提供或认可的任何形式的财务、投资、交易或其他类型的建议或推荐。请阅读使用条款了解更多信息。
免责声明
这些信息和出版物并非旨在提供,也不构成TradingView提供或认可的任何形式的财务、投资、交易或其他类型的建议或推荐。请阅读使用条款了解更多信息。