
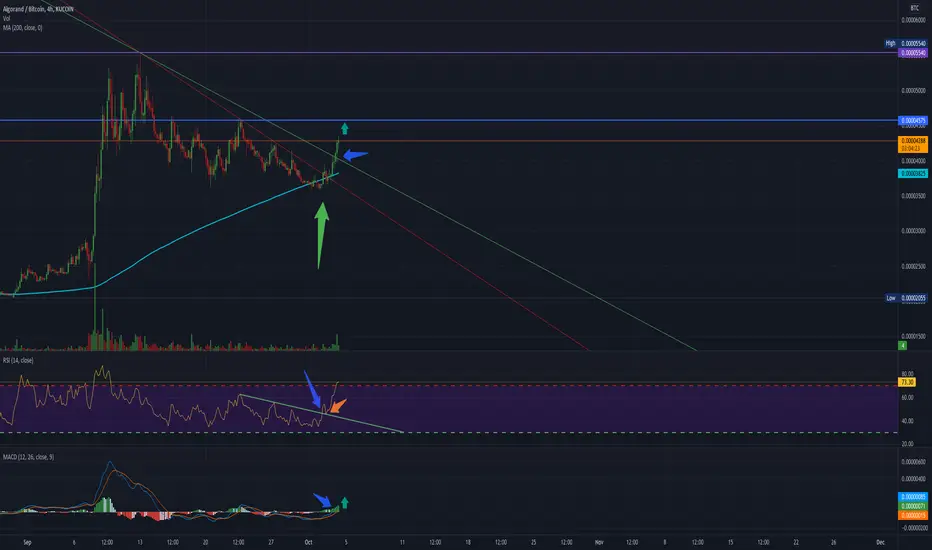
Here is a quick analysis of the ALGO/BTC chart pumping.
Next targets are resistances marked in horizontal ray blue at 4575 sats & purple at 5540 sats per ALGO coin.
Big green arrow shows how the trend tested the 200 MA and bounced off of it making to break the downtrend channel that was created.
RSI indicator shows how once the downtrend was broken (blue small arrow), it backtested before mooning (orange small arrow).
MACD Showing how positive momentum is building up... :)
注释
LOLOLOLOL
免责声明
这些信息和出版物并非旨在提供,也不构成TradingView提供或认可的任何形式的财务、投资、交易或其他类型的建议或推荐。请阅读使用条款了解更多信息。