
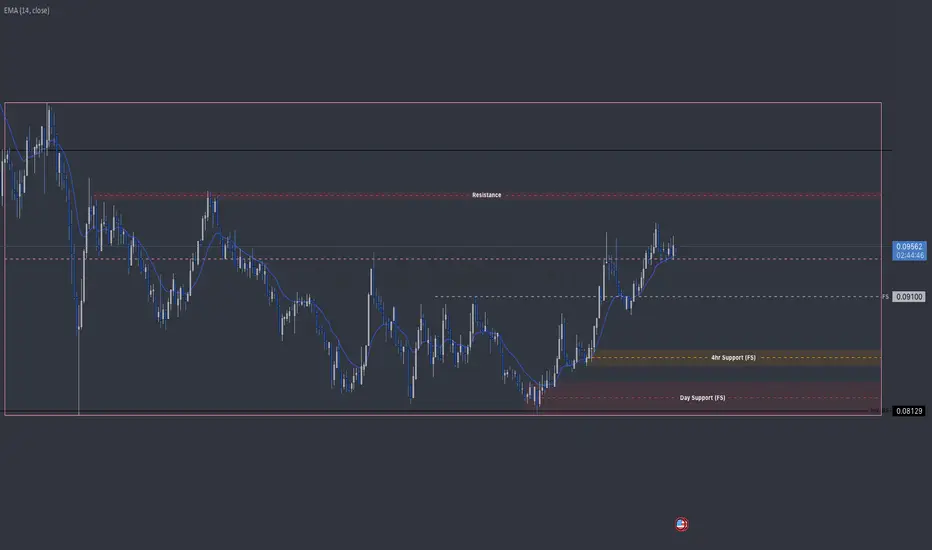
- T.A explained -
BackSide (BS)
FrontSide (FS)
Inverse BS (Inv.BS)
Inverse FS (Inv.FS)
BS & FS levels are expected support when dashed lines, tested when dotted and resistance when solid lines.
The inverse is true for the Inv. BS Inv. FS levels, they are resistance as dashed lines, tested as dotted and support as solid lines.
Monthly timeframe is color pink
weekly grey
daily is red
4hr is orange
1hr is yellow
15min is blue
5min is green if they are shown.
strength favors the higher timeframe.
BackSide (BS)
FrontSide (FS)
Inverse BS (Inv.BS)
Inverse FS (Inv.FS)
BS & FS levels are expected support when dashed lines, tested when dotted and resistance when solid lines.
The inverse is true for the Inv. BS Inv. FS levels, they are resistance as dashed lines, tested as dotted and support as solid lines.
Monthly timeframe is color pink
weekly grey
daily is red
4hr is orange
1hr is yellow
15min is blue
5min is green if they are shown.
strength favors the higher timeframe.
交易开始
If a 4hr level of interest is tested then, price needs to create distribution ladder on a 1hr timeframe or create the F.V.G and a steep angle trend to continue accumulation to higher targets. Price uses the topside of distribution candles as support. Price will need to engulf the sellers and us them to "ladder up". Do we see a 1hr timeframe ladder forming? We can also look at the 15min timeframe for confirmation of support structures being respected. If the resistance levels are being respected on lower timeframes, its less likely a higher timeframe support structure will hold.
交易结束:到达目标
The higher daily resistance zone was tested May 29 14:00 which was also backed by the weekly distribution trend. Price moved from the daily / weekly timeframes down to the weekly support level again. A yearly level (black) at .1048 was used as support for the month of May and failed June 3rd resulting in a yearly timeframe move to target the lower yearly level of support. .08注释

免责声明
这些信息和出版物并非旨在提供,也不构成TradingView提供或认可的任何形式的财务、投资、交易或其他类型的建议或推荐。请阅读使用条款了解更多信息。
免责声明
这些信息和出版物并非旨在提供,也不构成TradingView提供或认可的任何形式的财务、投资、交易或其他类型的建议或推荐。请阅读使用条款了解更多信息。