
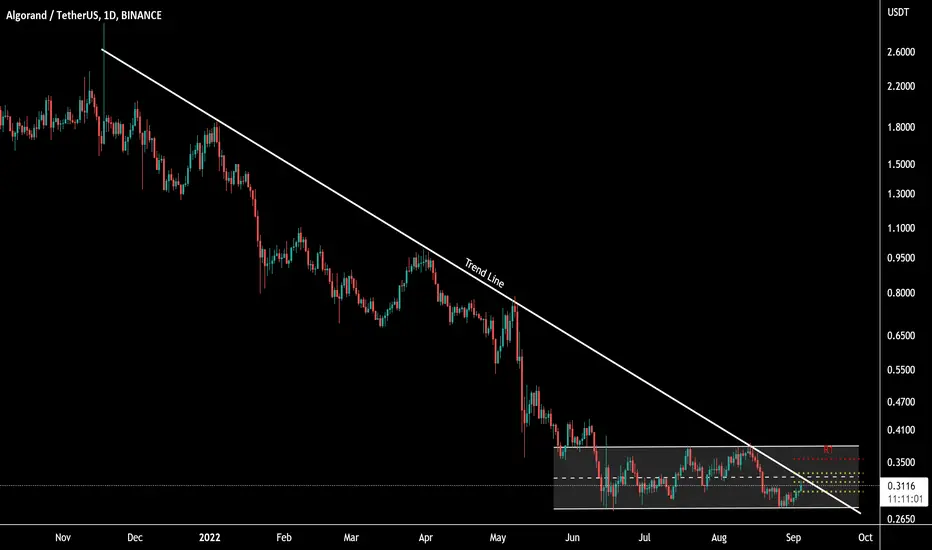
(Trend Line)
As the name implies, trend lines are levels used in technical analysis that can be drawn along a trend to represent either support or resistance, depending on the direction of the trend. Think of them as the diagonal equivalent of horizontal support and resistance.
Notice how shortly after breaking trend line resistance, the market came back to retest the trend line as new support and formed a bullish pin bar in the process.
This allowed price action traders to buy just before the market rallied for up trend

免责声明
这些信息和出版物并非旨在提供,也不构成TradingView提供或认可的任何形式的财务、投资、交易或其他类型的建议或推荐。请阅读使用条款了解更多信息。
免责声明
这些信息和出版物并非旨在提供,也不构成TradingView提供或认可的任何形式的财务、投资、交易或其他类型的建议或推荐。请阅读使用条款了解更多信息。