
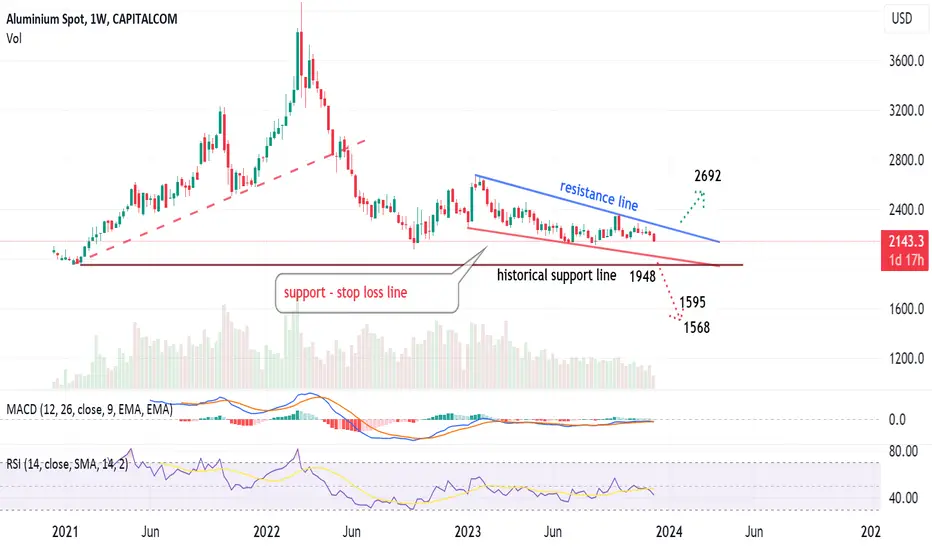
Weekly chart, Aluminum is showing negative indicators RSI and MACD. It seems the price is testing down the support line, then -may be- the historical support line.
Below that level, price can easily go to 1595 and 1568
Above resistance, the target is 2692
Below that level, price can easily go to 1595 and 1568
Above resistance, the target is 2692
交易开始
Aluminium price crossed the resistance line upwards, and activated the target
免责声明
这些信息和出版物并非旨在提供,也不构成TradingView提供或认可的任何形式的财务、投资、交易或其他类型的建议或推荐。请阅读使用条款了解更多信息。