AMB BTC all about - binance
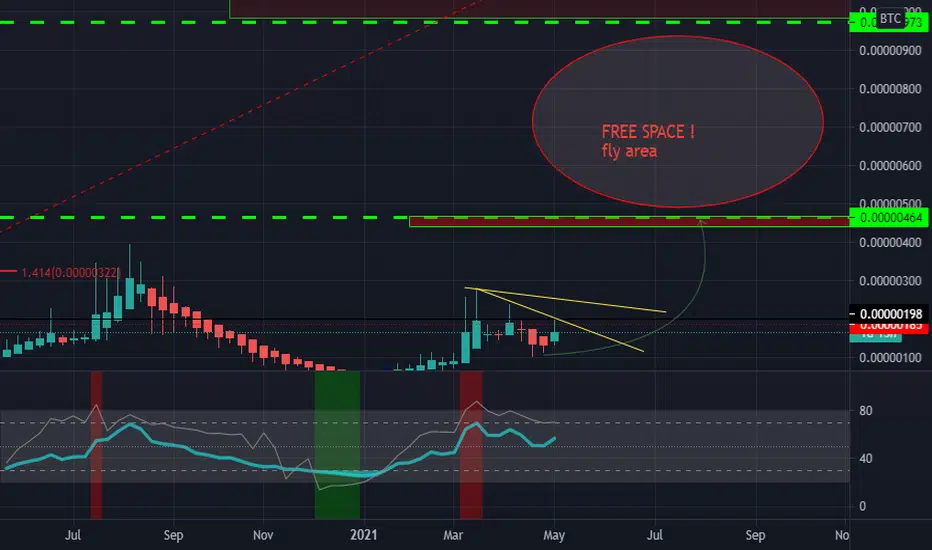
this 2 yellow line will break easy and soon if we take a look at weekly chart .
so what happening after that :
targets will be gap.
for example after 500 sat. until next resistance there is huge gap.
this possibility is not far from the mind due to the good condition of the weekly chart!
I want to be as optimistic about this as I was about a few months ago. (When it was 40 Satoshi).
and for short 440 - 500 sat can be target.
so what happening after that :
targets will be gap.
for example after 500 sat. until next resistance there is huge gap.
this possibility is not far from the mind due to the good condition of the weekly chart!
I want to be as optimistic about this as I was about a few months ago. (When it was 40 Satoshi).
and for short 440 - 500 sat can be target.

免责声明
这些信息和出版物并非旨在提供,也不构成TradingView提供或认可的任何形式的财务、投资、交易或其他类型的建议或推荐。请阅读使用条款了解更多信息。