
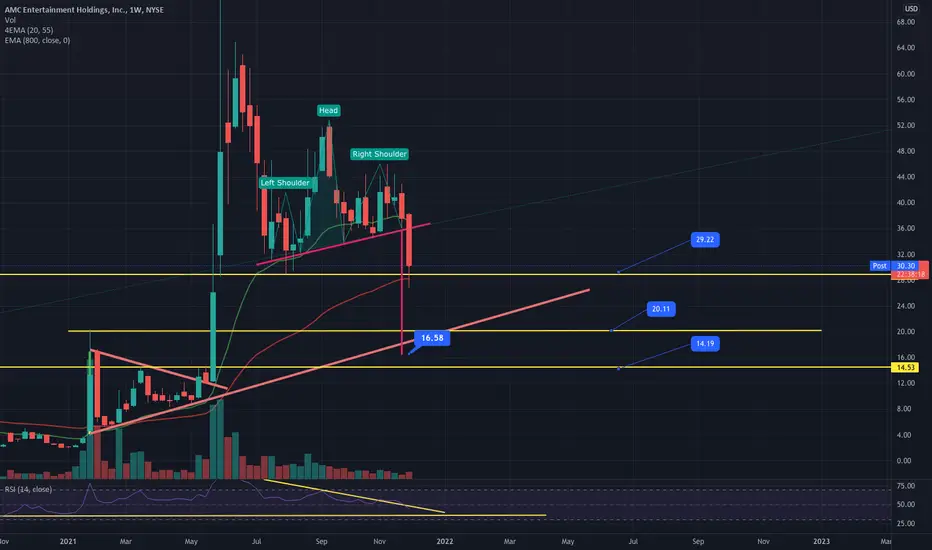
We can now see a clear head and shoulders pattern executed on the weekly time frame. The stock has bounced slightly off the 55 weekly moving average currently finding support at around $29 which was the previous swing low from August. The technical target from the head and shoulders pattern would bring the price to around $16.
Levels of support :
If we fail to hold support at $29 and lose the weekly 55 moving average we have $20 which is a previous swing high as labeled (top of previous pendant wick) and $14.33 ( previous swing high from first pendant.
Levels of support :
If we fail to hold support at $29 and lose the weekly 55 moving average we have $20 which is a previous swing high as labeled (top of previous pendant wick) and $14.33 ( previous swing high from first pendant.

免责声明
这些信息和出版物并非旨在提供,也不构成TradingView提供或认可的任何形式的财务、投资、交易或其他类型的建议或推荐。请阅读使用条款了解更多信息。
免责声明
这些信息和出版物并非旨在提供,也不构成TradingView提供或认可的任何形式的财务、投资、交易或其他类型的建议或推荐。请阅读使用条款了解更多信息。