
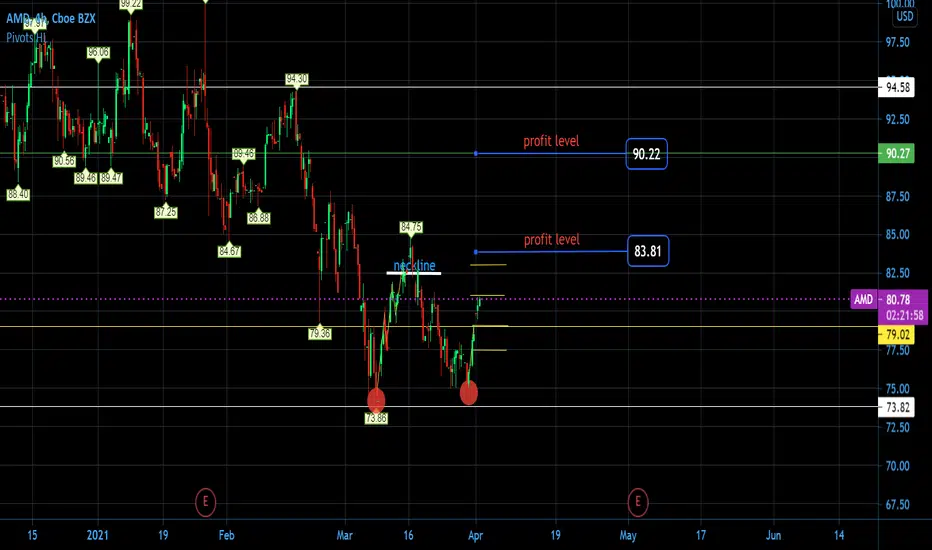
There are possible trades on AMD on the 4HR chart.
- A possible double bottom has formed and the neckline is labeled
- The yellow lines are possible entry points
- The lines labeled " Profit level" are possible exit points
*Do your own research this is for educational purposes not investment advice*
-If you like this idea please support by liking and comment if you agree/disagree
Thank you
- A possible double bottom has formed and the neckline is labeled
- The yellow lines are possible entry points
- The lines labeled " Profit level" are possible exit points
*Do your own research this is for educational purposes not investment advice*
-If you like this idea please support by liking and comment if you agree/disagree
Thank you

免责声明
这些信息和出版物并非旨在提供,也不构成TradingView提供或认可的任何形式的财务、投资、交易或其他类型的建议或推荐。请阅读使用条款了解更多信息。
免责声明
这些信息和出版物并非旨在提供,也不构成TradingView提供或认可的任何形式的财务、投资、交易或其他类型的建议或推荐。请阅读使用条款了解更多信息。