
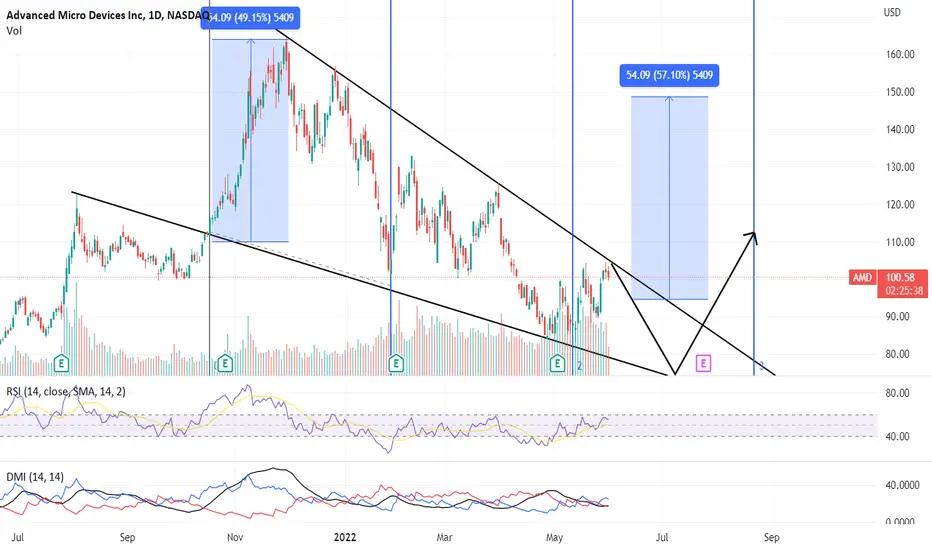
AMD on the daily chart and weekly chart showing a falling wedge pattern. It is also resisting the trendline. It needs to break out of the pattern with high volume is currently missing.
On the fib time cycle, it is in the third phase cycle and will take another month to break the pattern. On unconventional rsi it is resisting and going down it is suitable for shorting now up to 70 odd levels.
Then wait for a swing low around $70 - $75 for entry for a minimum risk to reward ratio. after breaking the pattern it may go up to the $150 level.
Watch out closely.
Cheers and Happy Trading..!!
#Keepitsimple #Tradeeasy
On the fib time cycle, it is in the third phase cycle and will take another month to break the pattern. On unconventional rsi it is resisting and going down it is suitable for shorting now up to 70 odd levels.
Then wait for a swing low around $70 - $75 for entry for a minimum risk to reward ratio. after breaking the pattern it may go up to the $150 level.
Watch out closely.
Cheers and Happy Trading..!!
#Keepitsimple #Tradeeasy

免责声明
这些信息和出版物并非旨在提供,也不构成TradingView提供或认可的任何形式的财务、投资、交易或其他类型的建议或推荐。请阅读使用条款了解更多信息。
免责声明
这些信息和出版物并非旨在提供,也不构成TradingView提供或认可的任何形式的财务、投资、交易或其他类型的建议或推荐。请阅读使用条款了解更多信息。