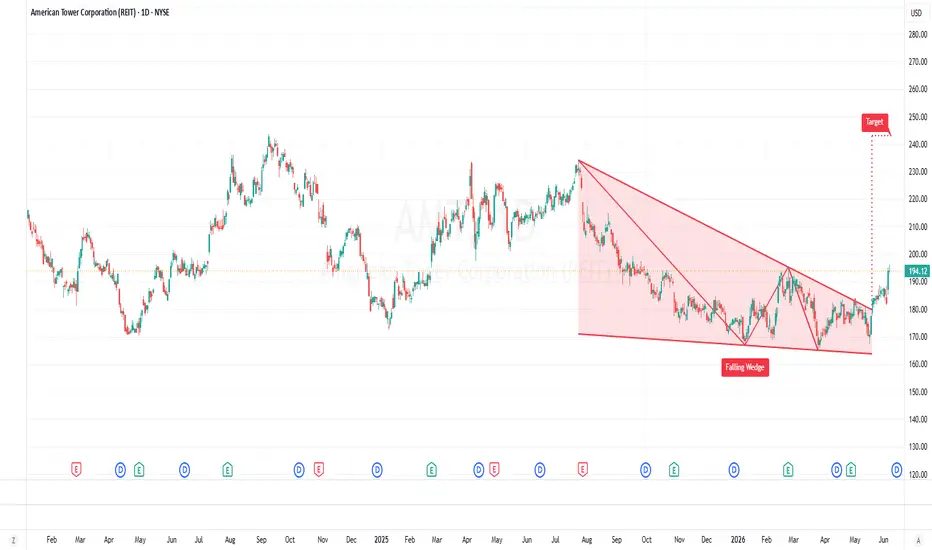
 AMT has successfully broken out of a falling wedge chart pattern on the daily (1D) timeframe, a bullish technical setup that often signals a potential trend reversal and continuation to the upside.
The breakout is supported by an improved price structure, indicating that buyers are regaining control after an extended period of consolidation. As long as the breakout level holds, the stock could continue its upward momentum toward the next key resistance zones.
Profit Targets:
Target 1: $221
Target 2: $243
Traders should monitor volume and price action around these levels for confirmation of continued strength. Follow an appropriate risk management strategy to protect your downside.
#AMT #AmericanTower #StockMarket #TechnicalAnalysis #SwingTrading #BreakoutTrading #ChartPatterns #FallingWedge #StocksToWatch #Investing #TradingIdeas #MarketAnalysis #PriceAction #BullishBreakout #NYSE

Author of the bestseller 'Start Trading Smart' | Founder - Tradewisenet Academy Pvt. Ltd.| Tradewisenet.com
免责声明
这些信息和出版物并非旨在提供,也不构成TradingView提供或认可的任何形式的财务、投资、交易或其他类型的建议或推荐。请阅读使用条款了解更多信息。
Author of the bestseller 'Start Trading Smart' | Founder - Tradewisenet Academy Pvt. Ltd.| Tradewisenet.com
免责声明
这些信息和出版物并非旨在提供,也不构成TradingView提供或认可的任何形式的财务、投资、交易或其他类型的建议或推荐。请阅读使用条款了解更多信息。