
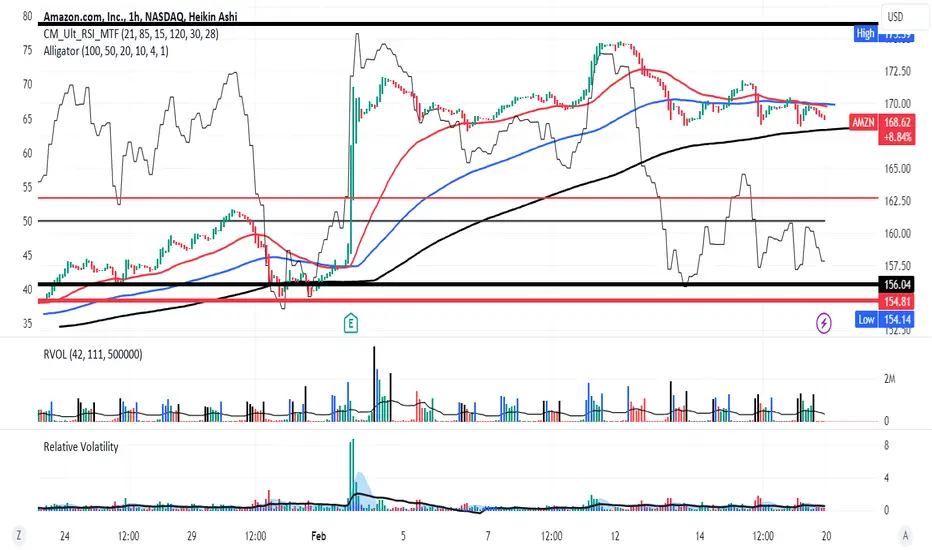
AMZN on the 60 minute chart since earnings shows the jump and the sideways consolidation
after that. Here the RSI is superimposed on the chart within its own 0-100 scale. It is currently
in what should be considered deep undervalued territory and at RSI support /demand. The
William's Alligator set of moving averages shows MA compression and so convergence.
AMZN's price is now in a tight range with volatility likewise compressed especially compared
with that at earnings. In short price is coiled, the potential energy is ready to get converted
to kinetic for those who have an understanding of classical physics.
All that said, I see AMZN as ready to roll. I will take long trades in shares and options as
AMZN is ready to hit the ground running.
after that. Here the RSI is superimposed on the chart within its own 0-100 scale. It is currently
in what should be considered deep undervalued territory and at RSI support /demand. The
William's Alligator set of moving averages shows MA compression and so convergence.
AMZN's price is now in a tight range with volatility likewise compressed especially compared
with that at earnings. In short price is coiled, the potential energy is ready to get converted
to kinetic for those who have an understanding of classical physics.
All that said, I see AMZN as ready to roll. I will take long trades in shares and options as
AMZN is ready to hit the ground running.

免责声明
这些信息和出版物并非旨在提供,也不构成TradingView提供或认可的任何形式的财务、投资、交易或其他类型的建议或推荐。请阅读使用条款了解更多信息。
免责声明
这些信息和出版物并非旨在提供,也不构成TradingView提供或认可的任何形式的财务、投资、交易或其他类型的建议或推荐。请阅读使用条款了解更多信息。