
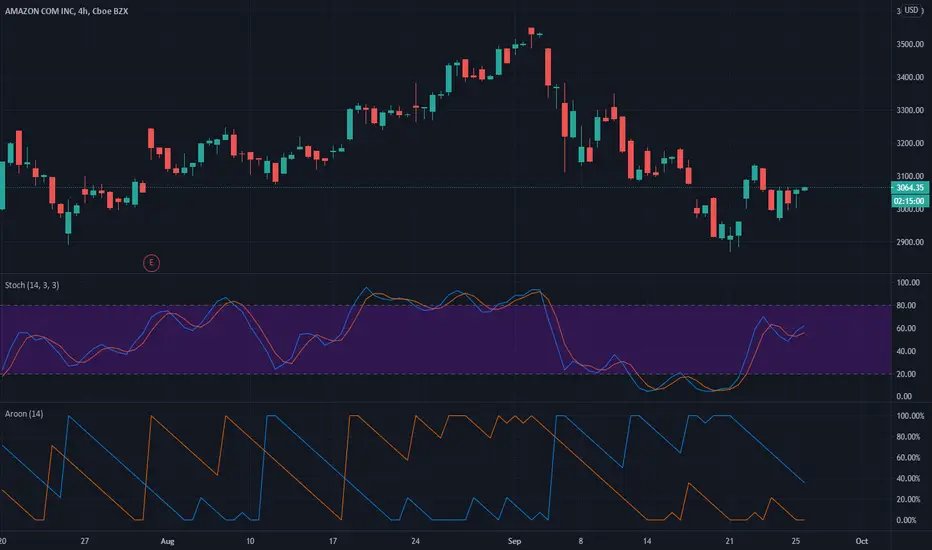
On September 23, 2020, the Stochastic Indicator for AMZN moved out of oversold territory and this could be a bullish sign for the stock. Traders may want to buy the stock or buy call options. Tickeron A.I.dvisor looked at 51 instances where the indicator left the oversold zone. In 42 of the 51 cases the stock moved higher in the following days. This puts the odds of a move higher at over 82%. Current price $3058.75 crossed the support line at $3000.12 and is trading between $3081.11 resistance and $3000.12 support lines. Throughout the month of 08/24/20 - 09/24/20, the price experienced a -9% Downtrend, while the week of 09/17/20 - 09/24/20 shows a +0.37% Uptrend.
Bullish Trend Analysis
Following a +5.89% 3-day Advance, the price is estimated to grow further. Considering data from situations where AMZN advanced for three days, in 285 of 394 cases, the price rose further within the following month. The odds of a continued upward trend are 72%.
AMZN may jump back above the lower band and head toward the middle band. Traders may consider buying the stock or exploring call options.
The Aroon Indicator entered an Uptrend today. In 247 of 348 cases where AMZN Aroon's Indicator entered an Uptrend, the price rose further within the following month. The odds of a continued Uptrend are 71%.
Bullish Trend Analysis
Following a +5.89% 3-day Advance, the price is estimated to grow further. Considering data from situations where AMZN advanced for three days, in 285 of 394 cases, the price rose further within the following month. The odds of a continued upward trend are 72%.
AMZN may jump back above the lower band and head toward the middle band. Traders may consider buying the stock or exploring call options.
The Aroon Indicator entered an Uptrend today. In 247 of 348 cases where AMZN Aroon's Indicator entered an Uptrend, the price rose further within the following month. The odds of a continued Uptrend are 71%.

免责声明
这些信息和出版物并非旨在提供,也不构成TradingView提供或认可的任何形式的财务、投资、交易或其他类型的建议或推荐。请阅读使用条款了解更多信息。