
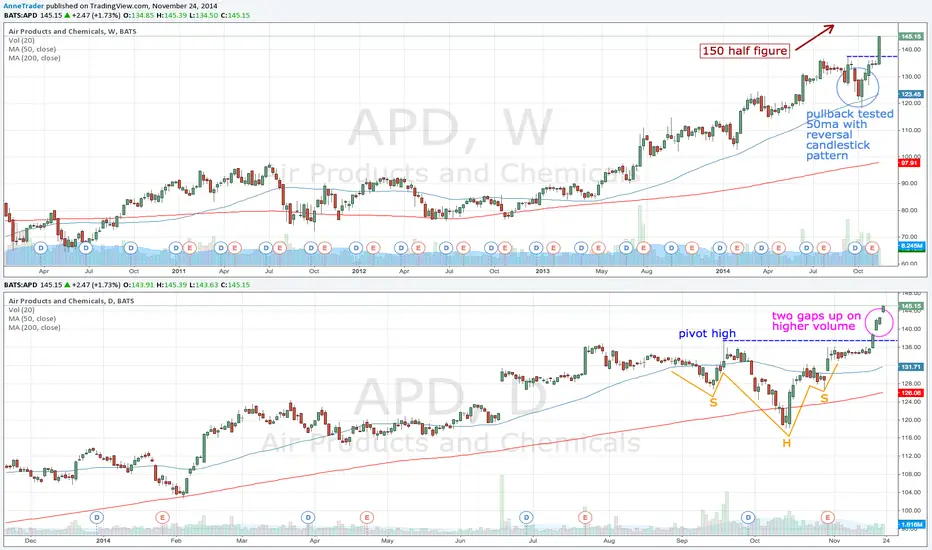
APD has been in an uptrend all year but the deep pullbacks have made it too unpredictable to long-term trade so far.
On the daily chart an inverted head and shoulders chart pattern offered an opportunity to trade a measured move up. Since the break of the pivot high (which also confirmed the H&S pattern) there have been two gaps up on slightly higher volume.
This had the potential set-up for an almost $20 move up but, if you missed the first gap, the risk:reward is rapidly declining.
It offers a very good buy for a short-term trade as the momentum is up (with the gap, volume and bullish bar all in the direction of the trend).
But for longer-term traders you may want to now wait for a break above the $150 half figure before looking to trade this one.
On the daily chart an inverted head and shoulders chart pattern offered an opportunity to trade a measured move up. Since the break of the pivot high (which also confirmed the H&S pattern) there have been two gaps up on slightly higher volume.
This had the potential set-up for an almost $20 move up but, if you missed the first gap, the risk:reward is rapidly declining.
It offers a very good buy for a short-term trade as the momentum is up (with the gap, volume and bullish bar all in the direction of the trend).
But for longer-term traders you may want to now wait for a break above the $150 half figure before looking to trade this one.

Web: dt.live
Instagram: instagram.com/dynamictrader
Twitter: twitter.com/dynamictrader
Instagram: instagram.com/dynamictrader
Twitter: twitter.com/dynamictrader
免责声明
这些信息和出版物并非旨在提供,也不构成TradingView提供或认可的任何形式的财务、投资、交易或其他类型的建议或推荐。请阅读使用条款了解更多信息。
Web: dt.live
Instagram: instagram.com/dynamictrader
Twitter: twitter.com/dynamictrader
Instagram: instagram.com/dynamictrader
Twitter: twitter.com/dynamictrader
免责声明
这些信息和出版物并非旨在提供,也不构成TradingView提供或认可的任何形式的财务、投资、交易或其他类型的建议或推荐。请阅读使用条款了解更多信息。