
Ape Coin (APE) technical analysis:
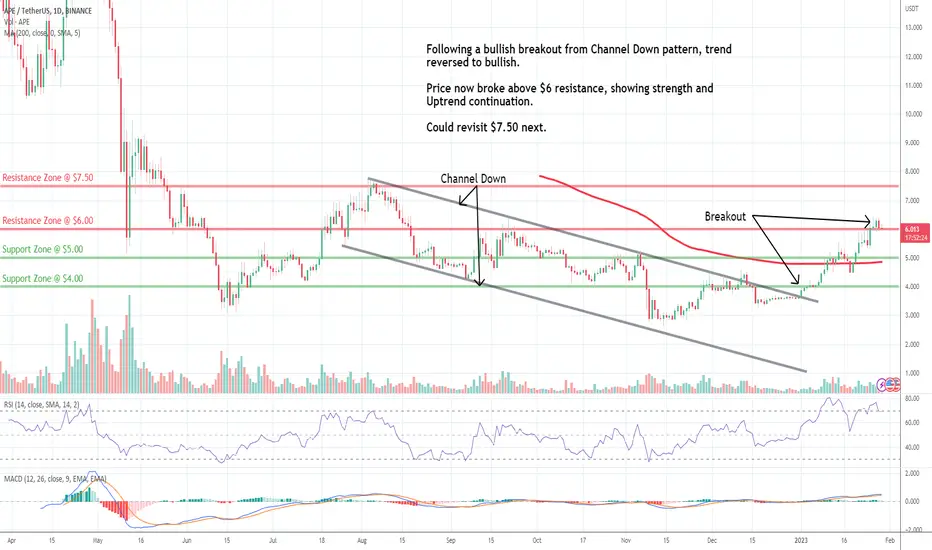
Trade setup: Following a bullish breakout from Channel Down pattern, trends reversed to bullish. Price now broke above $6 resistance, showing strength and Uptrend continuation. Could revisit $7.50 next.
Trend: Uptrend across all time horizons (Short- Medium- and Long-Term).
Momentum is Bullish ( MACD Line is above MACD Signal Line and RSI is above 55).
Support and Resistance: Nearest Support Zone is $5.00 (previous resistance), then $4.00. The nearest Resistance Zone is $6.00, which it broke, then $7.50.
Trade setup: Following a bullish breakout from Channel Down pattern, trends reversed to bullish. Price now broke above $6 resistance, showing strength and Uptrend continuation. Could revisit $7.50 next.
Trend: Uptrend across all time horizons (Short- Medium- and Long-Term).
Momentum is Bullish ( MACD Line is above MACD Signal Line and RSI is above 55).
Support and Resistance: Nearest Support Zone is $5.00 (previous resistance), then $4.00. The nearest Resistance Zone is $6.00, which it broke, then $7.50.

免责声明
这些信息和出版物并非旨在提供,也不构成TradingView提供或认可的任何形式的财务、投资、交易或其他类型的建议或推荐。请阅读使用条款了解更多信息。