
All you need to know:
🟩 Support Levels (visible on the chart)
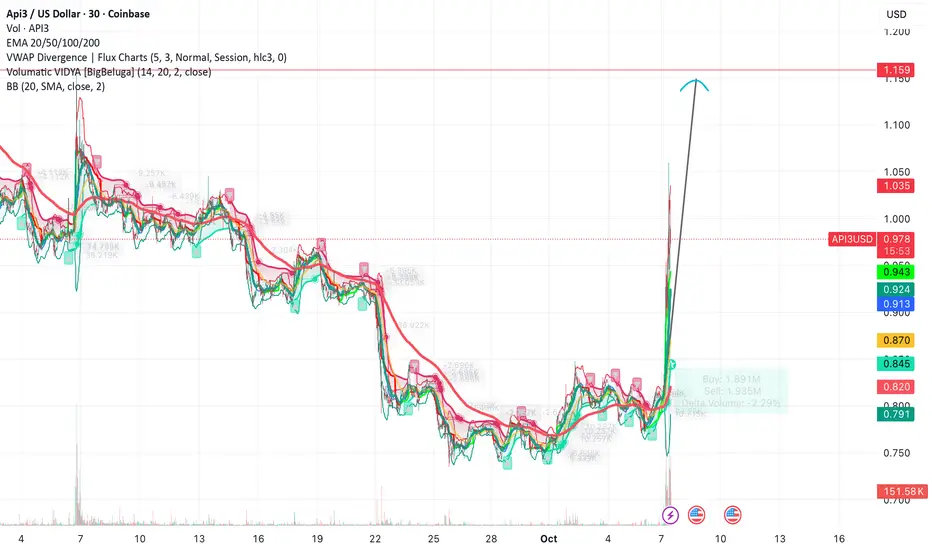
$0.791 — The lowest green EMA ribbon line at the bottom of the indicator cluster; this is a major support floor.
$0.820 – $0.871 — Multiple EMA levels (100/200) converge here, forming a strong support zone where price consolidated before the breakout.
$0.914 – $0.925 — Bollinger Band midline and EMA 50–20 cluster; acts as a short-term support area.
$0.943 — Labeled as VWAP Divergence (Flux Charts); current dynamic support after the breakout.
🟥 Resistance Levels (clearly marked on chart)
$1.037 — Marked horizontal red line labeled “BB 20 SMA close 2”; immediate overhead resistance.
$1.159 — The major resistance line shown in red near the top of the chart — likely the next key upside target (where the upward arrow points).
$1.200 (approx) — Slightly above the 1.159 mark; the top psychological zone visible on the price axis.
Currently a recent breakout upward move with a large green candle breaking above all moving averages and ribbons. Volume: 124.1K, confirming strong buying activity. EMA trend: Bullish crossover — all EMAs (20/50/100/200) are aligned upward.
⚙️ Visual Interpretation
The arrow drawn upward from $0.986 targets the $1.15–$1.16 resistance area, indicating bullish sentiment or an anticipated move toward that level.
If rejected near $1.037, price might retest supports near $0.94 or $0.92 before continuing higher.
✅ Summary from day chart
Immediate Support: $0.943 → $0.914 → $0.871
Immediate Resistance: $1.037 → $1.159
Short-term bullish momentum after strong breakout
Happy hunting!
🟩 Support Levels (visible on the chart)
$0.791 — The lowest green EMA ribbon line at the bottom of the indicator cluster; this is a major support floor.
$0.820 – $0.871 — Multiple EMA levels (100/200) converge here, forming a strong support zone where price consolidated before the breakout.
$0.914 – $0.925 — Bollinger Band midline and EMA 50–20 cluster; acts as a short-term support area.
$0.943 — Labeled as VWAP Divergence (Flux Charts); current dynamic support after the breakout.
🟥 Resistance Levels (clearly marked on chart)
$1.037 — Marked horizontal red line labeled “BB 20 SMA close 2”; immediate overhead resistance.
$1.159 — The major resistance line shown in red near the top of the chart — likely the next key upside target (where the upward arrow points).
$1.200 (approx) — Slightly above the 1.159 mark; the top psychological zone visible on the price axis.
Currently a recent breakout upward move with a large green candle breaking above all moving averages and ribbons. Volume: 124.1K, confirming strong buying activity. EMA trend: Bullish crossover — all EMAs (20/50/100/200) are aligned upward.
⚙️ Visual Interpretation
The arrow drawn upward from $0.986 targets the $1.15–$1.16 resistance area, indicating bullish sentiment or an anticipated move toward that level.
If rejected near $1.037, price might retest supports near $0.94 or $0.92 before continuing higher.
✅ Summary from day chart
Immediate Support: $0.943 → $0.914 → $0.871
Immediate Resistance: $1.037 → $1.159
Short-term bullish momentum after strong breakout
Happy hunting!

免责声明
这些信息和出版物并非旨在提供,也不构成TradingView提供或认可的任何形式的财务、投资、交易或其他类型的建议或推荐。请阅读使用条款了解更多信息。
免责声明
这些信息和出版物并非旨在提供,也不构成TradingView提供或认可的任何形式的财务、投资、交易或其他类型的建议或推荐。请阅读使用条款了解更多信息。