
Hello traders,
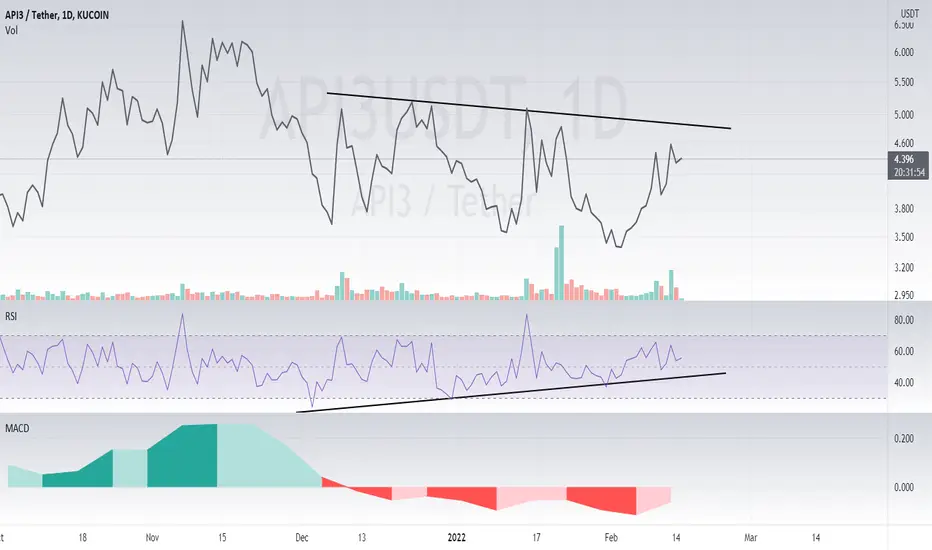
As you can see on the daily chart of API3, the price performance has been in a downtrend recently however the Momentum Oscillator (RSI) is showing a bullish divergence by presenting us with lower lows! The weekly MACD is also revealing a possible divergence to the green, I see a very low likely hood of it continuing to be red mainly due to the fact MACD's come in swings of 3, which we have already experienced.
Safe trading,
-Pulkanator
As you can see on the daily chart of API3, the price performance has been in a downtrend recently however the Momentum Oscillator (RSI) is showing a bullish divergence by presenting us with lower lows! The weekly MACD is also revealing a possible divergence to the green, I see a very low likely hood of it continuing to be red mainly due to the fact MACD's come in swings of 3, which we have already experienced.
Safe trading,
-Pulkanator

免责声明
这些信息和出版物并非旨在提供,也不构成TradingView提供或认可的任何形式的财务、投资、交易或其他类型的建议或推荐。请阅读使用条款了解更多信息。
免责声明
这些信息和出版物并非旨在提供,也不构成TradingView提供或认可的任何形式的财务、投资、交易或其他类型的建议或推荐。请阅读使用条款了解更多信息。