
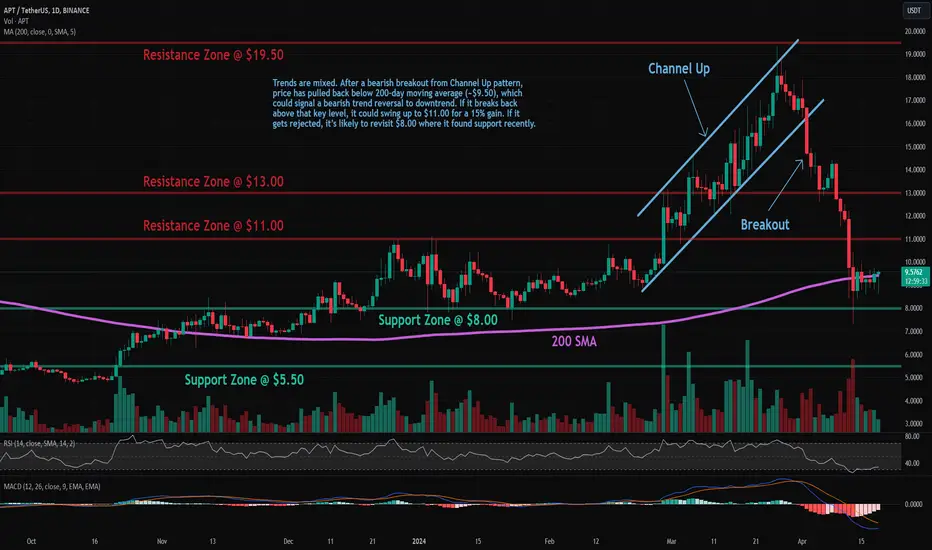
Trade setup: Trends are mixed. After a bearish breakout from Channel Up pattern, price has pulled back below 200-day moving average (~$9.50), which could signal a bearish trend reversal to downtrend. If it breaks back above that key level, it could swing up to $11.00 for a 15% gain. If it gets rejected, it’s likely to revisit $8.00 where it found support recently.
Trend: Downtrend on Short- and Medium-Term basis and Uptrend on Long-Term basis.
Momentum is Bearish but inflecting. MACD Line is below MACD Signal Line and RSI is below 45 but momentum may have bottomed since MACD Histogram bars are rising, which suggests that momentum could be nearing another upswing.
Support and Resistance: Nearest Support Zone is $8.00, then $5.50. The nearest Resistance Zone is $11.00, then $13.00 and $19.50.
Trend: Downtrend on Short- and Medium-Term basis and Uptrend on Long-Term basis.
Momentum is Bearish but inflecting. MACD Line is below MACD Signal Line and RSI is below 45 but momentum may have bottomed since MACD Histogram bars are rising, which suggests that momentum could be nearing another upswing.
Support and Resistance: Nearest Support Zone is $8.00, then $5.50. The nearest Resistance Zone is $11.00, then $13.00 and $19.50.

免责声明
这些信息和出版物并非旨在提供,也不构成TradingView提供或认可的任何形式的财务、投资、交易或其他类型的建议或推荐。请阅读使用条款了解更多信息。