
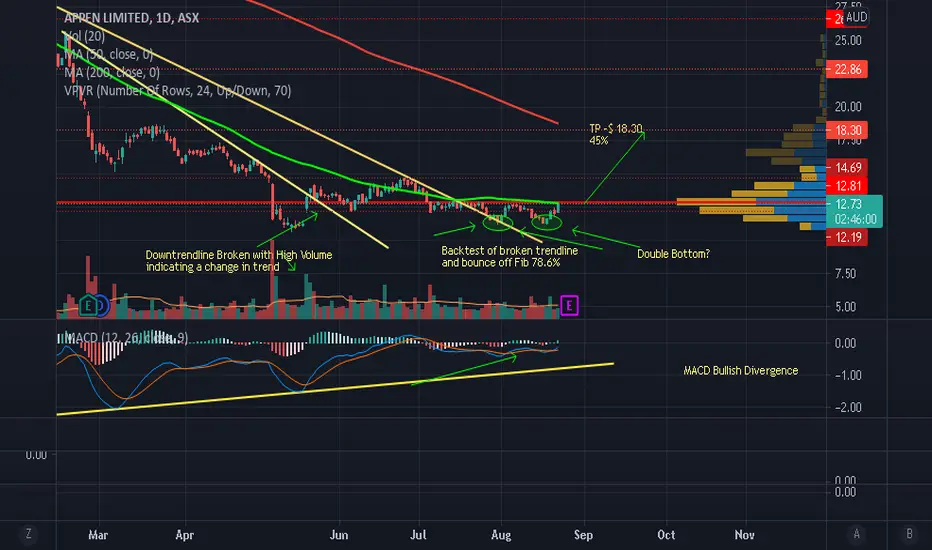
APX has been consolidating for a while but the price action is very telling. It plummeted hard since August 2020 after making a peak around $44.00 all the way down to $11.00 in May 2021, ( a Fibonacci retracement of 78.6% since its IPO). The recent price action indicates that the trend may have changed after it broke out of its downtrend line coupled with High Volume. Since its recent high of around $14.70, it pulled back to 78.6% and forming a potential double bottom which indicates that there is very good support. The global POC of its Volume Profile is at $12.40, which is also a good level of Strong Support. There is bullish divergence on the MACD which is a sign of exhaustion of Selling momentum.
I am bullish APX and expect price to thrust higher. My target is $18.30 with a stoploss below the double bottoms at $10.80.
Please note these are my own notes, by no means trading advice. Please do your own research before entering into any trade.
I am bullish APX and expect price to thrust higher. My target is $18.30 with a stoploss below the double bottoms at $10.80.
Please note these are my own notes, by no means trading advice. Please do your own research before entering into any trade.

免责声明
这些信息和出版物并非旨在提供,也不构成TradingView提供或认可的任何形式的财务、投资、交易或其他类型的建议或推荐。请阅读使用条款了解更多信息。
免责声明
这些信息和出版物并非旨在提供,也不构成TradingView提供或认可的任何形式的财务、投资、交易或其他类型的建议或推荐。请阅读使用条款了解更多信息。