
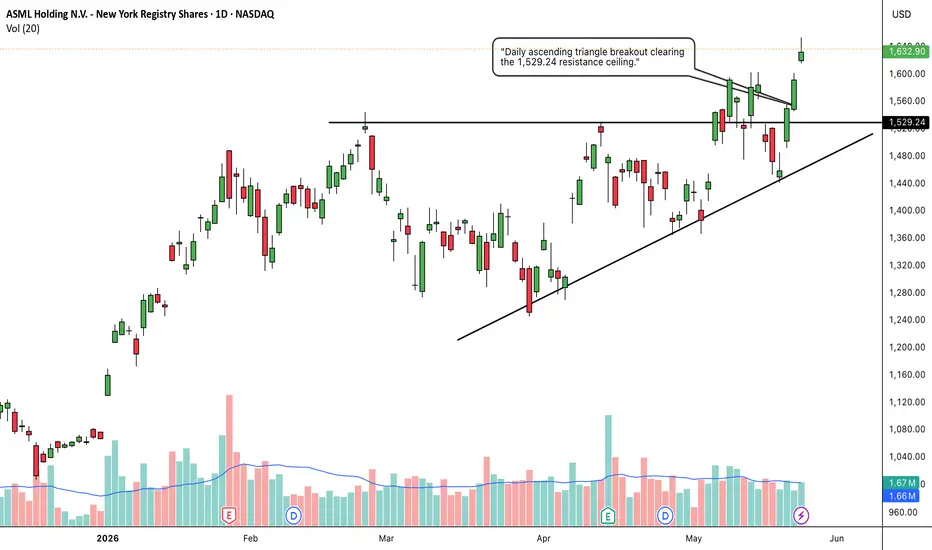
1. The Macro Perspective: The Secular Tech LeaderI am taking a LONG bias on ASML Holding N.V. (ASML) on the daily (1D) timeframe.When analyzing pure market structure on a mega-cap technology leader, periods of horizontal digestion are essential before the next major leg up. Following a strong rally in early 2026, the stock entered a multi-month consolidation phase. Rather than collapsing, institutional buyers stepped in at progressively higher prices, establishing a clear sequence of higher lows. Fundamentally, this technical strength aligns with recent news that UBS raised its price target on ASML, citing rising demand for AI chips and predicting a prolonged investment cycle extending into 2028. Additionally, the company recently announced a strategic partnership with Tata Electronics to advance India's semiconductor manufacturing ecosystem, reinforcing ASML's global dominance. 2. The Educational Setup: The Ascending TriangleTo understand the absolute technical validity behind this setup, look at the key components forming the accumulation structure:The Rising Support Floor: Notice the diagonal trendline starting from the mid-March lows. Buyers consistently defended the daily 20 SMA (the middle blue line of the Bollinger Bands), carving out a sequence of higher lows. This indicates that institutional accumulation was becoming increasingly aggressive.The 1,529.24 Resistance Ceiling: While the lows were getting higher, the highs were being capped by a massive horizontal resistance line drawn at 1,529.24. The price action compressed tightly between the rising trendline and this rigid ceiling, forming a textbook Ascending Triangle. This pattern represents a volatility squeeze, where demand systematically overpowers supply until the ceiling breaks.3. Current Price Action: Volatility Expansion and BreakoutLook at the recent cluster of daily candles on the right side of the chart. The structural pressure cooker has exploded. Buyers have stepped in with undeniable conviction, printing a powerful sequence of green expansion candles that decisively shattered the 1,529.24 horizontal ceiling. The stock is currently trading around the 1,632.90 level, up 2.57% on the session. By closing cleanly above this multi-month resistance block, the price has transitioned out of the ascending triangle compression phase and into a high-volatility markup trend.4. The Trade Plan: Entries, Targets, and Risk ManagementEntry Strategy: Momentum is currently very strong, with the stock trading out in the open above the breakout line. Chasing an extended daily move carries a short-term mean-reversion risk. The highest-probability, lowest-risk entry strategy involves waiting for a minor structural cooling-off period. Look to scale into long positions or place limit orders to catch a potential pullback that retests the broken 1,520.00 to 1,540.00 neckline zone. Letting old historical resistance prove itself as a concrete new support floor offers a phenomenal risk-to-reward ratio.Take Profit (Targets): We use a classical measured move strategy based on the depth of the ascending triangle pattern. By taking the maximum depth of the pattern (roughly 290 points from the ~1,240 base up to the 1,529.24 ceiling) and projecting it upward from the breakout point, our primary structural target sits comfortably in the 1,800.00 to 1,820.00 zone over the coming weeks.Invalidation (Stop Loss): An ascending triangle breakout thesis is invalidated if the price fails to hold its newly claimed structural floor and collapses back below the rising trendline. A hard stop loss should be placed safely below the daily 20 SMA cushion and the recent higher low, specifically around the 1,410.00 to 1,430.00 level. A definitive daily close completely back below 1,400.00 would act as a severe warning sign of a failed macro breakout and a major bull trap.5. Time Horizon:Because this technical setup is built on a 1-Day chart capturing a classic structural continuation pattern and a clear horizontal breakout, this is a high-alpha swing trade designed to capture a rapid momentum markup phase over the coming weeks. Let the trend run!
交易结束:到达目标
Target already achieved.
免责声明
这些信息和出版物并非旨在提供,也不构成TradingView提供或认可的任何形式的财务、投资、交易或其他类型的建议或推荐。请阅读使用条款了解更多信息。
免责声明
这些信息和出版物并非旨在提供,也不构成TradingView提供或认可的任何形式的财务、投资、交易或其他类型的建议或推荐。请阅读使用条款了解更多信息。