
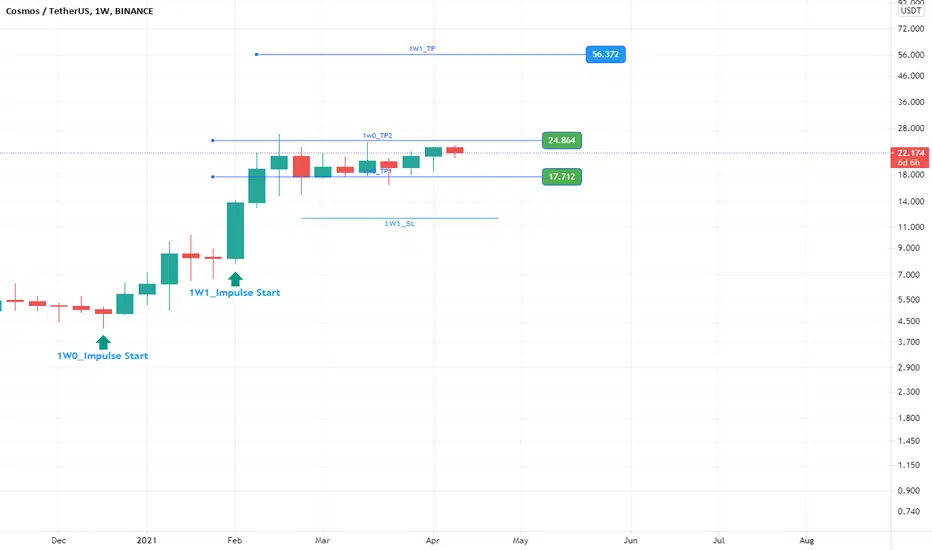
THINK Simple is my approach. there are no more lines and too many shapes on chart. its simple to understand. if you are looking for complicated analysis so community is full of them. I respect them all.
now go to chart
I calculate Border line and Take profit points(Price note Labels) based on :
1-price movement
2-price start, high and retracement
3-market state( bullish or bearish )
4-i don't look for S & R lines(but if you found border line and price are according to them it is a very good Sign)
5-GREEN PRICE Labels are Targets that Reached in previous predictions
6-RED PRICE Labels are those cancelled or Stopped
7-BLUE PRICE Labels are in progress
now go to chart
I calculate Border line and Take profit points(Price note Labels) based on :
1-price movement
2-price start, high and retracement
3-market state( bullish or bearish )
4-i don't look for S & R lines(but if you found border line and price are according to them it is a very good Sign)
5-GREEN PRICE Labels are Targets that Reached in previous predictions
6-RED PRICE Labels are those cancelled or Stopped
7-BLUE PRICE Labels are in progress
交易结束:到达目标

免责声明
这些信息和出版物并非旨在提供,也不构成TradingView提供或认可的任何形式的财务、投资、交易或其他类型的建议或推荐。请阅读使用条款了解更多信息。
免责声明
这些信息和出版物并非旨在提供,也不构成TradingView提供或认可的任何形式的财务、投资、交易或其他类型的建议或推荐。请阅读使用条款了解更多信息。