

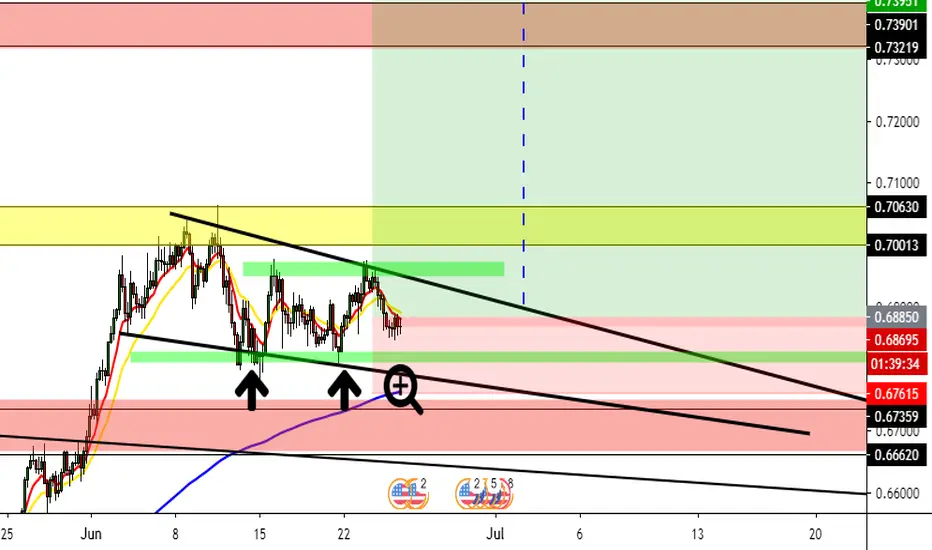
Today, we have found down a possible formation of tripple bottom, because this green zone are strong support, and if the price doesn't broke down this support, there are a possibility to continue to up the trend and that correction of elliot wave # 4 it's get validated.
And so, it's a possible bullish signal and we need to stay alert when the price leave at this zone. Well, now, if we look that appears a bullish candlestick signal a hammer, doji bullish or big bullish candlestick, we could to buy at this zone with a Stop Loss considered. As my posiiton are active, so I do not closed up and did you noticed it. because in Daily timeframe we see a bullish.
Also, while the tripple bottom formation, we have in the bullish rising wedge, and this mean a bullish pattern.

But, now in Daily we see very clear the strong support mark in green, and so, if we get the initial of the trend in the blue dark arrow, we can see a poryect more of what I expect of my target profit.
And so, it's a possible bullish signal and we need to stay alert when the price leave at this zone. Well, now, if we look that appears a bullish candlestick signal a hammer, doji bullish or big bullish candlestick, we could to buy at this zone with a Stop Loss considered. As my posiiton are active, so I do not closed up and did you noticed it. because in Daily timeframe we see a bullish.
Also, while the tripple bottom formation, we have in the bullish rising wedge, and this mean a bullish pattern.
But, now in Daily we see very clear the strong support mark in green, and so, if we get the initial of the trend in the blue dark arrow, we can see a poryect more of what I expect of my target profit.

免责声明
这些信息和出版物并非旨在提供,也不构成TradingView提供或认可的任何形式的财务、投资、交易或其他类型的建议或推荐。请阅读使用条款了解更多信息。
免责声明
这些信息和出版物并非旨在提供,也不构成TradingView提供或认可的任何形式的财务、投资、交易或其他类型的建议或推荐。请阅读使用条款了解更多信息。