

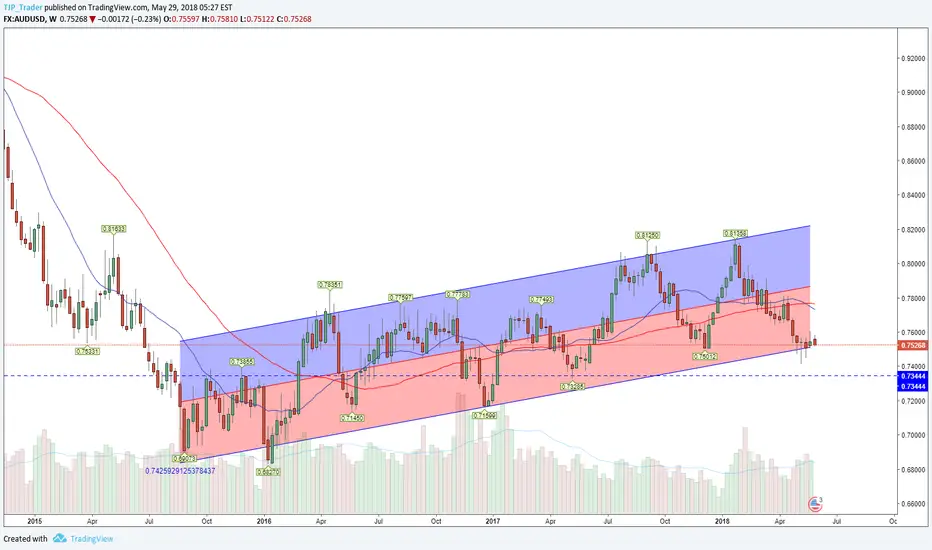
As highlighted in the chart , the Aussie has been trending in a nice bullish channel on the weekly timeframe since Q3 2015 and we are currently seeing a test of trendline support which was last tested in December 2016 and preceeded a bounce from 0.71 to 0.76
Looking forward from today it would not be unrealistic to expect rates to cross the centre line which would take us to 0.786 as an interim target with max target currently 0.82-3 based on the grad,if we project forward using the angle of the last wave up we could expect to reach the target in 12 bars (84 days)
If we see a breakdown below the sloping support line then the author suggests stops to be placed just under the May 2017 dip (0.73285) which will give a risk reward of just above 3:1 on the trade , in the event of a drop below the trendline we'd like to see to see a strong bullish engulfing candle (see the Jan 2016 dip) to retain conviction in the trend dynamic.
Summary
Buy at Support on the regression trendline, initial stop at 0.73285, target 0.82-3, trail stop on close above centre line

免责声明
这些信息和出版物并非旨在提供,也不构成TradingView提供或认可的任何形式的财务、投资、交易或其他类型的建议或推荐。请阅读使用条款了解更多信息。
免责声明
这些信息和出版物并非旨在提供,也不构成TradingView提供或认可的任何形式的财务、投资、交易或其他类型的建议或推荐。请阅读使用条款了解更多信息。