

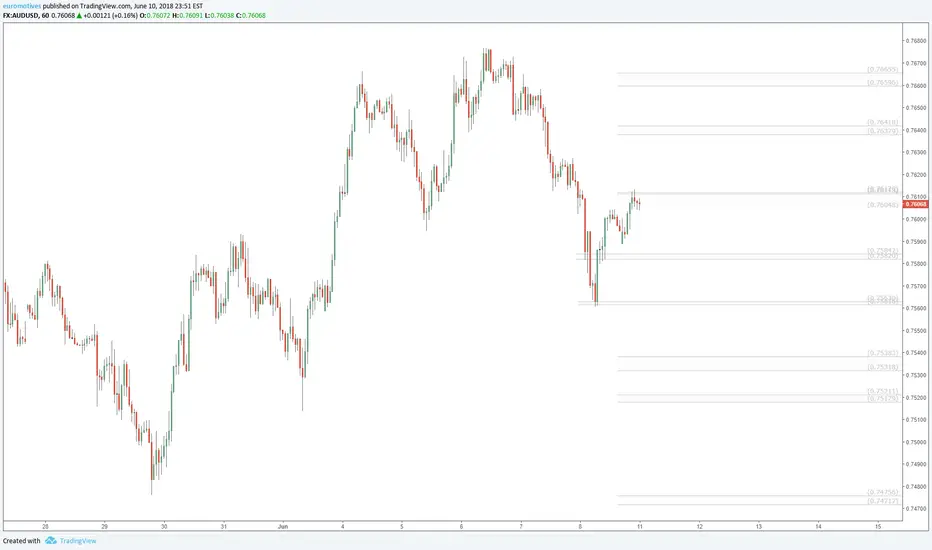
These zones are calculated using Fibonacci Ratios of past price moves.
Where prices overlap, drag the Right (price) Axis up to magnify and reduce overlap vertically.
There are zones above and below the current window, Drag the Chart up/down to see other zones.
Drag bottom axis to the left to magnify the candle size to view close up.
I will update as new zones are defined by upcoming Fibs.
Where prices overlap, drag the Right (price) Axis up to magnify and reduce overlap vertically.
There are zones above and below the current window, Drag the Chart up/down to see other zones.
Drag bottom axis to the left to magnify the candle size to view close up.
I will update as new zones are defined by upcoming Fibs.
注释
Fibs dont lie.it is these ''Wide Open Patches'' that traders live for.
When I see a space like that, I go over my fibs repeatedly to confirm there is nothing between those zones. Apparently in this case there really was NOTHING between these zones.
注释
Barely stopping even after crossing the desert.If price does not retrace any of this zone (at last 23.6%), then AU will drop much more, just most of the USD pairs I guess....

the Golden Ratio is my Religion
the Trading View is my Nation
the Moderator Tag is my Flag
the Trading View is my Nation
the Moderator Tag is my Flag
相关出版物
免责声明
这些信息和出版物并非旨在提供,也不构成TradingView提供或认可的任何形式的财务、投资、交易或其他类型的建议或推荐。请阅读使用条款了解更多信息。
the Golden Ratio is my Religion
the Trading View is my Nation
the Moderator Tag is my Flag
the Trading View is my Nation
the Moderator Tag is my Flag
相关出版物
免责声明
这些信息和出版物并非旨在提供,也不构成TradingView提供或认可的任何形式的财务、投资、交易或其他类型的建议或推荐。请阅读使用条款了解更多信息。