
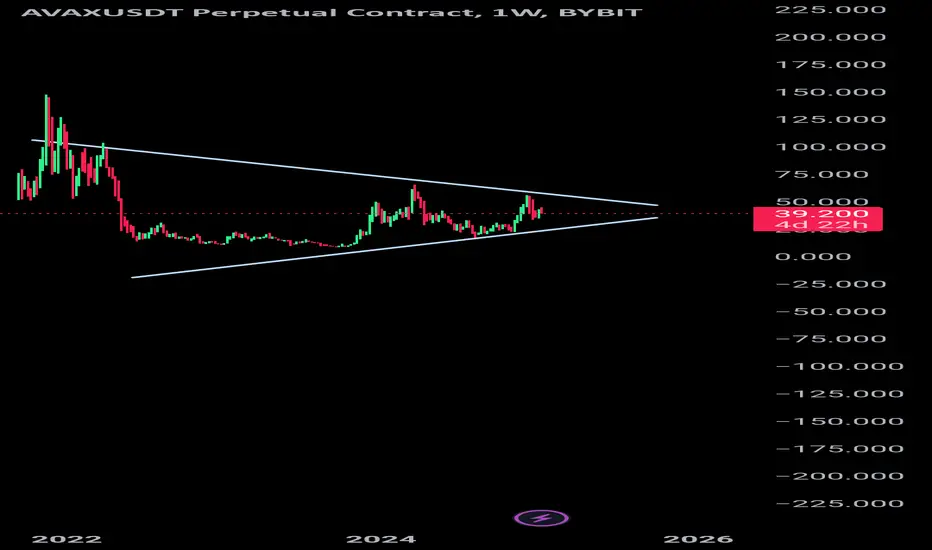
The chart illustrates a classic symmetrical triangle pattern on the weekly timeframe, suggesting a period of consolidation before a potential breakout. The price is holding above the 50-week moving average (MA50), reinforcing the bullish outlook.
Key Observations
The symmetrical triangle indicates indecision in the market, with buyers and sellers converging.
Holding above the MA50 signals strong support and a likelihood of upward momentum.
A confirmed breakout above the upper trendline will validate the bullish scenario and trigger significant upward movement.
Targets Upon Breakout
$61 - $149
Strategic Implications
Patience is key. Monitor for a breakout with strong volume confirmation above the triangle's resistance. Failure to break out may result in continued consolidation within the pattern. This setup offers significant potential for medium to long-term gains if the breakout materializes.

免责声明
这些信息和出版物并非旨在提供,也不构成TradingView提供或认可的任何形式的财务、投资、交易或其他类型的建议或推荐。请阅读使用条款了解更多信息。
免责声明
这些信息和出版物并非旨在提供,也不构成TradingView提供或认可的任何形式的财务、投资、交易或其他类型的建议或推荐。请阅读使用条款了解更多信息。