
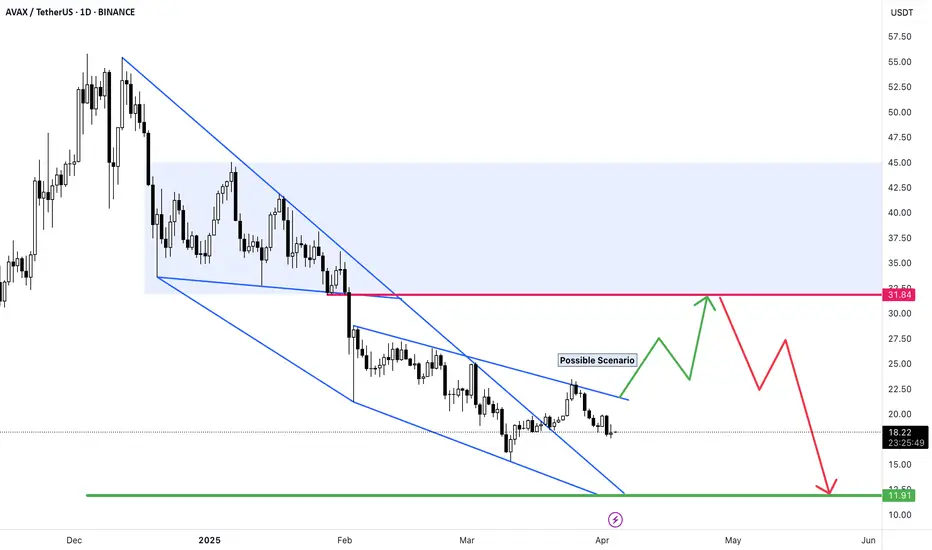
Possible Scenario for AVAX/USDT:
1. Price Action: The price is within a descending channel marked by the blue lines. This suggests a bearish trend as the price has been making lower highs and lower lows.
2. Potential Scenarios:
- The **green arrow** indicates a potential bullish scenario, where the price might break out to the upside, aiming toward a target of around $31.84.
- The **red arrow** suggests a bearish scenario, where the price might break down further, potentially testing the lower support level near $11.91.
3. Key Levels:
- **Resistance**: Around the $31.84 level (shown in red), which could be a strong resistance zone if the price attempts a recovery.
- **Support**: Near the $11.91 level (shown in green), which could act as strong support if the downtrend continues.
1. Price Action: The price is within a descending channel marked by the blue lines. This suggests a bearish trend as the price has been making lower highs and lower lows.
2. Potential Scenarios:
- The **green arrow** indicates a potential bullish scenario, where the price might break out to the upside, aiming toward a target of around $31.84.
- The **red arrow** suggests a bearish scenario, where the price might break down further, potentially testing the lower support level near $11.91.
3. Key Levels:
- **Resistance**: Around the $31.84 level (shown in red), which could be a strong resistance zone if the price attempts a recovery.
- **Support**: Near the $11.91 level (shown in green), which could act as strong support if the downtrend continues.

Telegram: t.me/Crypto_Sheykh
免责声明
这些信息和出版物并非旨在提供,也不构成TradingView提供或认可的任何形式的财务、投资、交易或其他类型的建议或推荐。请阅读使用条款了解更多信息。
Telegram: t.me/Crypto_Sheykh
免责声明
这些信息和出版物并非旨在提供,也不构成TradingView提供或认可的任何形式的财务、投资、交易或其他类型的建议或推荐。请阅读使用条款了解更多信息。