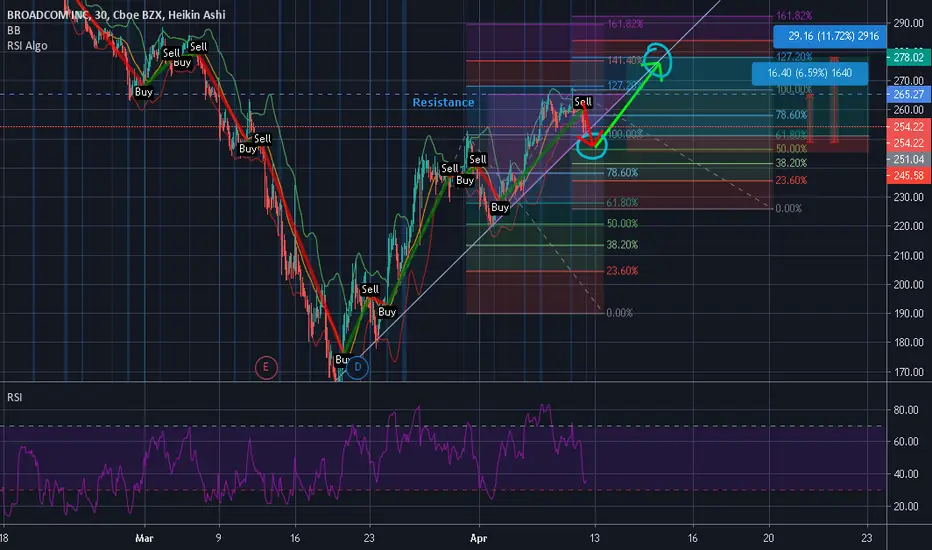
Technological stock  AVGO goes down and this is opportunity for LONG position.
The analysis based on Bollinger Bands (21,2) and RSI (30,70). We can see at 258$ the BB breakout when the RSI indicate to wait for more drop down.
Together with support trend line it's yield a strong buy at 254$.
Two scenarios are possible, the stock still goes down below 254$ , then RSI ALGO (8,65,35) will indicate the time to buy, otherwise the stock will start go up immediately to 278.02$ . This idea should not be considered a buy or sell recommendation.
AVGO goes down and this is opportunity for LONG position.The analysis based on Bollinger Bands (21,2) and RSI (30,70). We can see at 258$ the BB breakout when the RSI indicate to wait for more drop down.
Together with support trend line it's yield a strong buy at 254$.
Two scenarios are possible, the stock still goes down below 254$ , then RSI ALGO (8,65,35) will indicate the time to buy, otherwise the stock will start go up immediately to 278.02$ . This idea should not be considered a buy or sell recommendation.

免责声明
这些信息和出版物并非旨在提供,也不构成TradingView提供或认可的任何形式的财务、投资、交易或其他类型的建议或推荐。请阅读使用条款了解更多信息。